Tag Archives: electricity prices

California wants to kill rooftop solar — all because officials were duped by this flawed theory


I wrote this article (with editorial assistance) in the San Francisco Chronicle on how California regulators and policy makers are looking to the wrong “villain” as the root of California’s high electricity rates. The problem is derived directly from utility spending which has increased one-to-one with rate increases.

We have published a deeper analysis of this issue in a white paper, and I have written other posts that discuss deeper issues and responses to rebuttals elsewhere on this blog.

How California got such high rates: the history of missed utility forecasts

A key driver in rising California electricity rates has been distribution costs as shown in the chart above. The distribution rate component has been increasing in lock step with utilities’ revenue requirements since at least 2002. Purported load departure has had no measurable impact on rates as the value of energy efficiency and distributed energy resources have closely mirrored the displaced utility spending over that period.

The most likely source of the increase in distribution costs is overforecasting load growth in the utilities’ General Rate Cases (GRC) after 2006. As described in this California Solar & Storage Association (CalSSA) whitepaper, customer investment in rooftop solar displaced load growth and CAISO peak demands have remained flat, but utility forecasts failed to account for this.

While testifying on behalf of the Agricultural Energy Consumers Association (AECA) in PG&E and SCE GRC Phase IIs from 2009 to 2018 we presented data comparing the accuracy of the utilities forecasts to those from the California Energy Commission’s Integrated Energy Policy Report (IEPR). The IEPR forecasts were consistently much more accurate (and still biased high.) (We moved on to different issues after 2018.)

The first chart shows how PG&E consistently misforecasted. SCE shows the same biased errors in the second chart. An important source of this error appears to be the utilities failing to reconcile the sum of local planning area and division forecasts with the overall system forecast. We asked for data showing this reconciliation but never received evidence of this critical task. Starting in 2018, however, the utilities started using local area forecasts created by the CEC which mitigates this source of error.

Nevertheless, the utilities requested, and the CPUC authorized, large investments that increased the distribution rate base which then rolls into the revenue requirements and rates. The assets installed in excess of demand simply accumulated in the investment ratebase and the additional excess from the next GRC was layered on top. The two charts below show for PG&E and SCE the cumulative amount of overforecast over three GRCs. These imply that each utility was authorized to build substantially more infrastructure than what was actually needed. For PG&E this amounted to 99% by 2019 and for SCE, 76% more by 2017.

These investments facilitated by the forecast errors kept accreting but the CPUC never went back to audit whether theses assets were actually used and useful. If not used and useful, the CPUC could act to disallow recovery of these costs until load growth is sufficient to create a need for these lines and transformers.

In PG&E’s 1996 GRC, AECA showed that the utility was planning to add substantial distribution infrastructure in the farmlands around Fresno for suburban growth that was unlikely to materialize. The CPUC agreed with us and refused to authorize that investment. It took substantial effort by this intervenor to prepare that analysis, but it demonstrated the effectiveness of such oversight that has not been duplicated by the CPUC elsewhere.

This lack of oversight and action is one reason why the policy of decoupling, which separates cost recovery from sales, has failed to control costs in California. Decoupling may have reduced utilities’ opposition to energy efficiency (although now they are coming after rooftop solar which has an identical effect as energy efficiency), but the utilities quickly discovered that the CPUC did not have either the capabilities or the appetite to penalize overinvestment. This is the root cause of California’s high rates.

Response to Borenstein’s critique of our assessment of the benefits of rooftop solar

Severin Borenstein at the Energy Institute at the Haas Business School posted a reply[1] to our analysis[2] of the Public Advocates Office’s claim[3] of a large “cost shift” created by rooftop solar customers to other customers. Here is my extended reply to Borenstein’s critique.

  • Issues of agreement: Borenstein acknowledges that the PAO used an incorrect capacity factor to calculate the total amount of rooftop solar generation. He also acknowledged that the monthly bill payments from rooftop solar customers should be included in the calculation, an error that both PAO and he has previously committed. Further, he agreed, with caveats, that the rate reductions and subsidy savings for low-income CARE customers should be included. Those elements alone add up to reducing PAO’s claimed cost shift approaching $2 billion or 25%
  • Self generation: Borenstein and the PAO ignore the fact that self generation is not included in any utility resource planning. Rooftop solar generation is counted in load forecasts as a load reduction just like energy efficiency. Grid investments, generation capacity and operational decisions such as reserve margins all focus solely on metered load that excludes all self generation.. Borenstein mistakenly asserts that grid and self-provided power mingles, obviating the right to self generation. If there is generation and consumption onsite at the same time, those electrons do not touch the grid. Along with the fact that the energy does not mix, legal precedents and analysis by leading regulators contradict Borenstein’s (and PAO’s) position. Further, the NEM tariffs explicitly recognize the right to self generate for the term of the tariff.
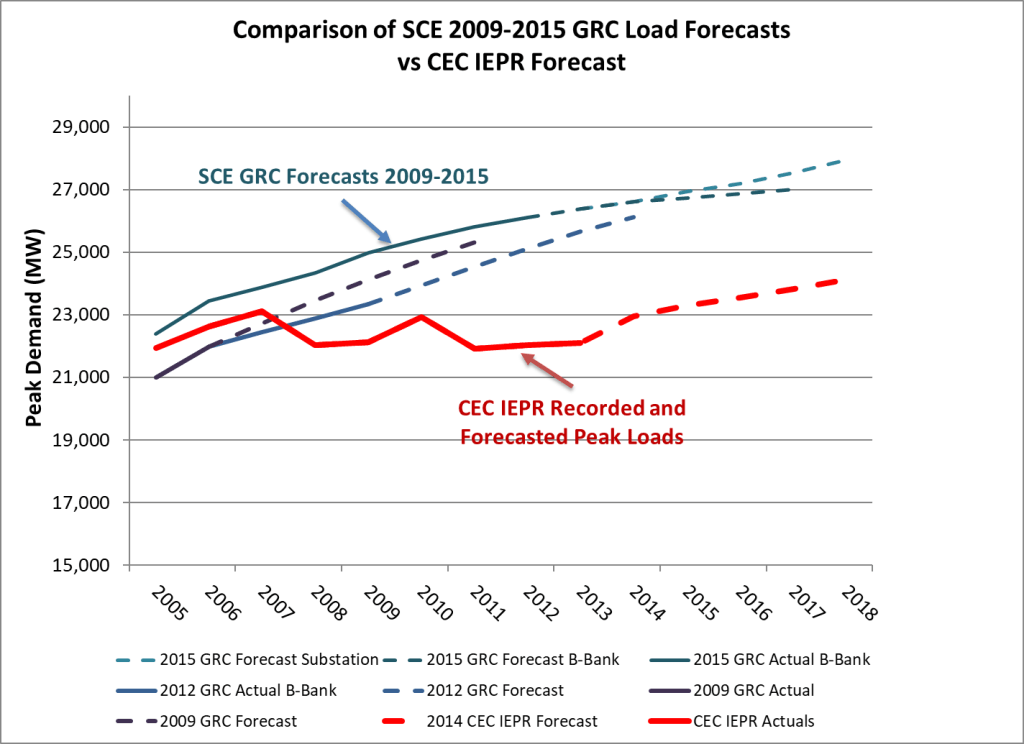
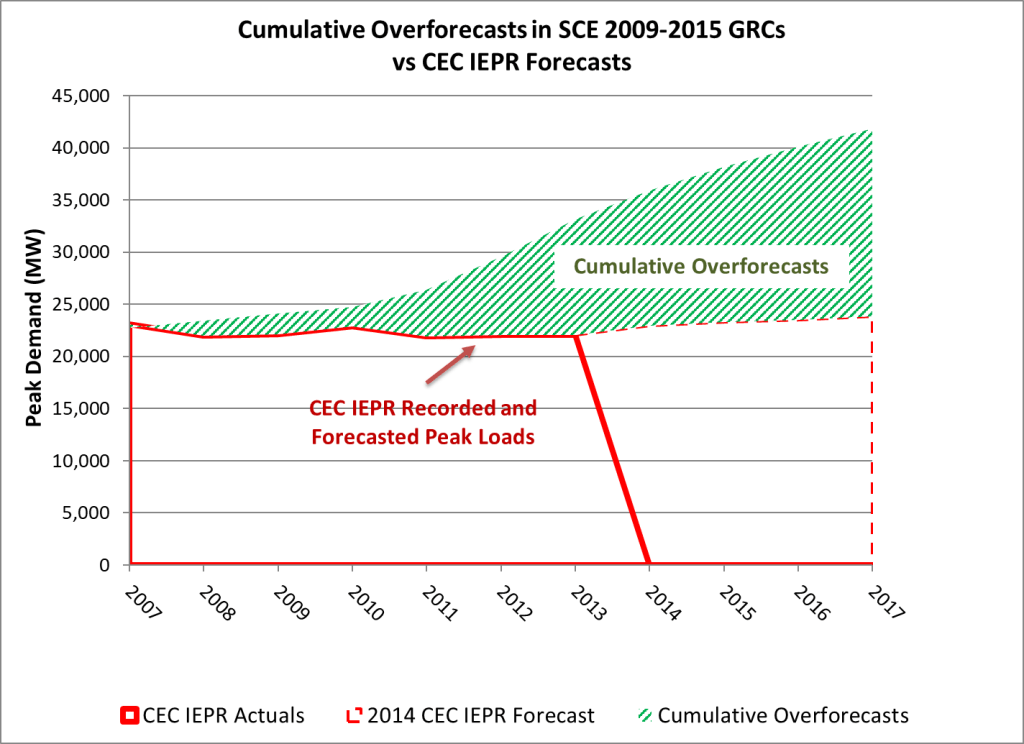
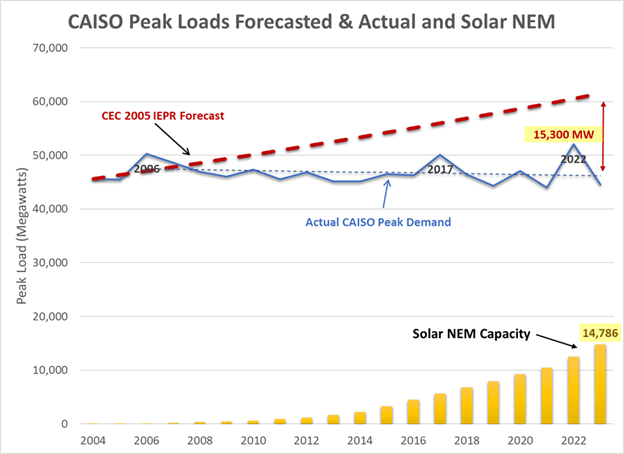
  • Historic utility savings: Borenstein, like PAO, creates a confusing “apples-to-oranges” comparison of historic costs vs. projected future savings. The Avoided Cost Calculator does not include information about historic costs and therefore cannot be used to calculate historic savings from previously installed rooftop solar systems. Using this tool to estimate how much utilities would have spent were it not for previous solar installations is highly inaccurate. The ACC does not have this data. Rates do not reflect future value. In addition, Borenstein ignores suppression of peak load growth since 2006 by the addition of rooftop solar. He confuses the total customer peak served by all resources including rooftop solar with the CAISO metered peak served only by utility resources, asserting that rooftop solar provides little value to meeting today’s metered peak. Only by recreating the costs that would have been borne by ratepayers over the last two decades can the actual savings and reduction in rates be calculated.
  • Customer Bill Payment: While he agrees bill payments should be included in the PAO’s analysis, but he focuses only on the cost-shift burden and fails to acknowledge the contribution to utility fixed costs made by these customers. The appropriate comparison is customer bill payments compared to utility fixed costs per customer. My analysis shows solar customers more than cover utility fixed costs.
  • Overall savings provided to all ratepayers from rooftop solar conservatively is $1.5 billion in 2024.

Further observations

To start, the focus of our analysis is on the Public Advocates Office (PAO) report issued in August 2024. We used PAO’s own spreadsheet as the base of the analysis and supplemented that with other sources. The critique of Borenstein’s analysis is collateral and, compared to that of the PAO analysis, is limited to the questions of self generation and how to calculate the cost savings created by rooftop solar. His capacity factor, inclusion of CARE customers and applicable retail rates are much closer to those that I used. I pointed out in my blog post that Borenstein had not made the mistakes that PAO had made on technical issues.

Yet on the other hand, Borenstein’s own spreadsheet was documented in a small, cryptic “Readme” file,[4] and the final calculation of the “cost shift” was a set of raw values with no internal calculations. When I recreated those calculations, I could not exactly duplicate what Borenstein presented. Similarly, the PAO’s spreadsheet was sparse on documentation. Most of what is shown in my workpapers are my own additions, not PAO’s.

Finally, many of the sources that Borenstein refers to are in fact himself. The NRDC citation relies on his own Next10 report. The LAO report cites back to his own blog post. He refers to his own critique of NEM from four years ago to criticize the NEM 3.0/NBT framework that was finalized two years later. That analysis is likely now obsolete.

As for being an “industry consultant,” a sample of our recent clients shows their diversity where we have worked for environmental organizations, water districts and utilities, agricultural and business associations intervening at the CPUC, CCAs, county governments, tribes, regional energy networks, state agencies, and lately solar advocates. We must present analyses that are sufficiently balanced so as to be credible with all of these different stakeholders. Further, our work is carefully documented and our data and assumptions completely transparent, unlike the work of Borenstein or the PAO.

(I will also note that Borenstein has apparently blocked me on LinkedIn so that he can exclude me from the discussion taking place on his post there.)


[1] See https://energyathaas.wordpress.com/2025/01/27/guess-what-didnt-kill-rooftop-solar/

[2] See https://mcubedecon.com/2024/11/14/how-californias-rooftop-solar-customers-benefit-other-ratepayers-financially-to-the-tune-of-1-5-billion/

[3] See https://www.publicadvocates.cpuc.ca.gov/-/media/cal-advocates-website/files/press-room/reports-and-analyses/240822-public-advocates-office-2024-nem-cost-shift-fact-sheet.pdf

[4] Published with his April 2024 blog post.

Replying to PAO’s response on its rooftop solar “cost shift” analysis

The Public Advocates Office (PAO) issued a response November 25, 2024 to M.Cubed’s critique of the PAO report issued August 22, 2024 asserting that rooftop solar customers had created an $8.5 billion annual “cost shift” to other ratepayers. M.Cubed’s analysis walked through the PAO analysis step by step and documented the flaws and errors in that analysis, arriving at the conclusion rooftop customers had created a net benefit of $1.5 billion per year in 2024. Here, we reply to the PAO’s flawed assessment.

It is readily apparent that the PAO did not examine the workpapers issued by M.Cubed supporting the calculations. Instead, the PAO generally asserted with no additional evidence that it was correct in all ways. Again, there is no supporting analysis beyond three simplistic calculations to back up the original claim.


Why are real-time electricity retail rates no longer important in California?

The California Public Utilities Commission (CPUC) has been looking at whether and how to apply real-time electricity prices in several utility rate applications. “Real time pricing” involves directly linking the bulk wholesale market price from an exchange such as the California Independent System Operator (CAISO) to the hourly retail price paid by customers. Other charges such as for distribution and public purpose programs are added to this cost to reach the full retail rate. In Texas, many retail customers have their rates tied directly or indirectly to the ERCOT system market that operates in a manner similar to CAISO’s. A number of economists have been pushing for this change as a key solution to managing California’s reliability issues. Unfortunately, the moment may have passed where this can have a meaningful impact.

In California, the bulk power market costs are less than 20% of the total residential rate. Even if we throw in the average capacity prices, it only reaches 25%. In addition, California has a few needle peaks a year compared to the much flatter, longer, more frequent near peak loads in the East due to the differences in humidity. The CAISO market can go years without real price deviations that are consequential on bills. For example, PG&E’s system average rate is almost 24 cents per kilowatt-hour (and residential is even higher). Yet, the average price in the CAISO market has remained at 3 to 4 cents per kilowatt-hour since 2001, and the cost of capacity has actually fallen to about 2 cents. Even a sustained period of high prices such as occurred last August will increase the average price by less than a penny–that’s less than 5% of the total rate. The story in 2005 was different, when this concept was first offered with an average rate of 13 cents per kilowatt-hour (and that was after the 4 cent adder from the energy crisis). In other words, the “variable” component just isn’t important enough to make a real difference.

Ahmad Faruqui who has been a long time advocate for dynamic retail pricing wrote in a LinkedIn comment:

“Airlines, hotels, car rentals, movie theaters, sporting events — all use time-varying rates. Even the simple parking meter has a TOU rate embedded in it.”

It’s true that these prices vary with time, and electricity prices are headed that way if not there already. Yet these industries don’t have prices that change instantly with changes in demand and resource availability–the prices are often set months ahead based on expectations of supply and demand, much as traditional electricity TOU rates are set already. Additionally, in all of these industries , the price variations are substantially less than 100%. But for electricity, when the dynamic price changes are important, they can be up to 1,000%. I doubt any of these industries would use pricing variations that large for practical reasons.

Rather than pointing out that this tool is available and some types of these being used elsewhere, we should be asking why the tool isn’t being used? What’s so different about electricity and are we making the right comparisons?

Instead, we might look at a different package to incorporate customer resources and load dynamism based on what has worked so far.

  • First is to have TOU pricing with predictable patterns. California largely already has this in place, and many customer groups have shown how they respond to this signal. In the Statewide Pilot on critical peak period price, the bulk of the load shifting occurred due to the implementation of a base TOU rate, and the CPP effect was relatively smaller.
  • Second, to enable more distributed energy resources (DER) is to have fixed price contracts akin to generation PPAs. Everyone understands the terms of the contracts then instead of the implicit arrangement of net energy metering (NEM) that is very unsatisfactory for everyone now. It also means that we have to get away from the mistaken belief that short-run prices or marginal costs represent “market value” for electricity assets.
  • Third for managing load we should have robust demand management/response programs that target the truly manageable loads, and we should compensate customers based on the full avoided costs created.

The two problems to be addressed head on by nuclear power advocates

6e0c32214e80ee9f4fbabf2e4ffe6fcd

Nuclear power advocates bring up the technology as a supposedly necessary part of a zero-GHG portfolio to address climate change. They insist that the “next generation” technology will be a winner if it is allowed to be developed.

Nevertheless, nuclear has two significant problems beyond whatever is in the next generation technology:

  1. Construction cost overruns are the single biggest liability that has been killing the technology. While most large engineering projects have contingencies for 25-30% overruns, almost all nuclear plants have overruns that are multiples of the original cost estimates. This has been driving the most experienced engineering/construction firms into bankruptcies. Until that problem is resolved, all energy providers should be very leery of making commitments to a technology that takes at least 7 years to build.
  2. We still haven’t addressed waste disposal and storage over the course of decades, much less millennia. No other energy technology presents such a degree of catastrophic failure from a single source. Again, this liability needs to be addressed head on and not ignored or dismissed if the technology is to be pursued.

Why the CPUC’s RA Market Report gives the wrong reliability price metric

wecc_639_343_80

In its annual report on resource adequacy (RA) transactions, the CPUC reports the wrong result for the market price to be used for valuing capacity from the RA market data. The Commission’s decision issued in the PCIA rulemaking on establishing the CCA’s “exit fee” uses this value in error. In the CAISO energy and ancillary services markets, the market clearing price used to set the value of the energy portfolio is determined by the highest accepted bid in a single hour, and then averaged across all hours. In contrast, the average reported RA price in The 2017 Resource Adequacy Report incorrectly reports the average of all transactions. This would be equivalent to the CAISO reporting the average of all accepted bids, including those at zero or even negative, as the market clearing price.

The appropriate RA price metric is the highest RA transaction price for each month. This price represents the market equilibrium point at which a consumer is willing to pay the highest price given how low a price a supplier is willing to provide that quantity of the resource. (The other transactions are called “inframarginal” and such transactions are common in many markets.) In a full auction market, all transactions would clear at this single price, which is why the CAISO reports a single market clearing price for all transactions in a single hour. That should also be the case for the RA market price, except the time unit is a month.

Due to a lack of an auction for the moment, it is possible to manipulate the highest apparent price through a bilateral transaction. Instead, the Commission could choose a price near the highest point, but with sufficient market depth to mitigate potential manipulation. Using the 90th percentile transaction is one metric commonly used based on a quick survey of market price reports.