This report by Next10 and the University of California Energy Institute was prepared for the CPUC’s en banc hearing February 24. The report compares average electricity rates against other states, and against an estimate of “marginal costs”. (The latter estimate is too low but appears to rely mostly on the E3 Avoided Cost Calculator.) It shows those rates to be multiples of the marginal costs. (PG&E’s General Rate Case workpapers calculates that its rates are about double the marginal costs estimated in that proceeding.) The study attempts to list the reasons why the authors think these rates are too high, but it misses the real drivers on these rate increases. It also uses an incorrect method for calculating the market value of acquisitions and deferred investments, using the current market value instead of the value at the time that the decisions were made.
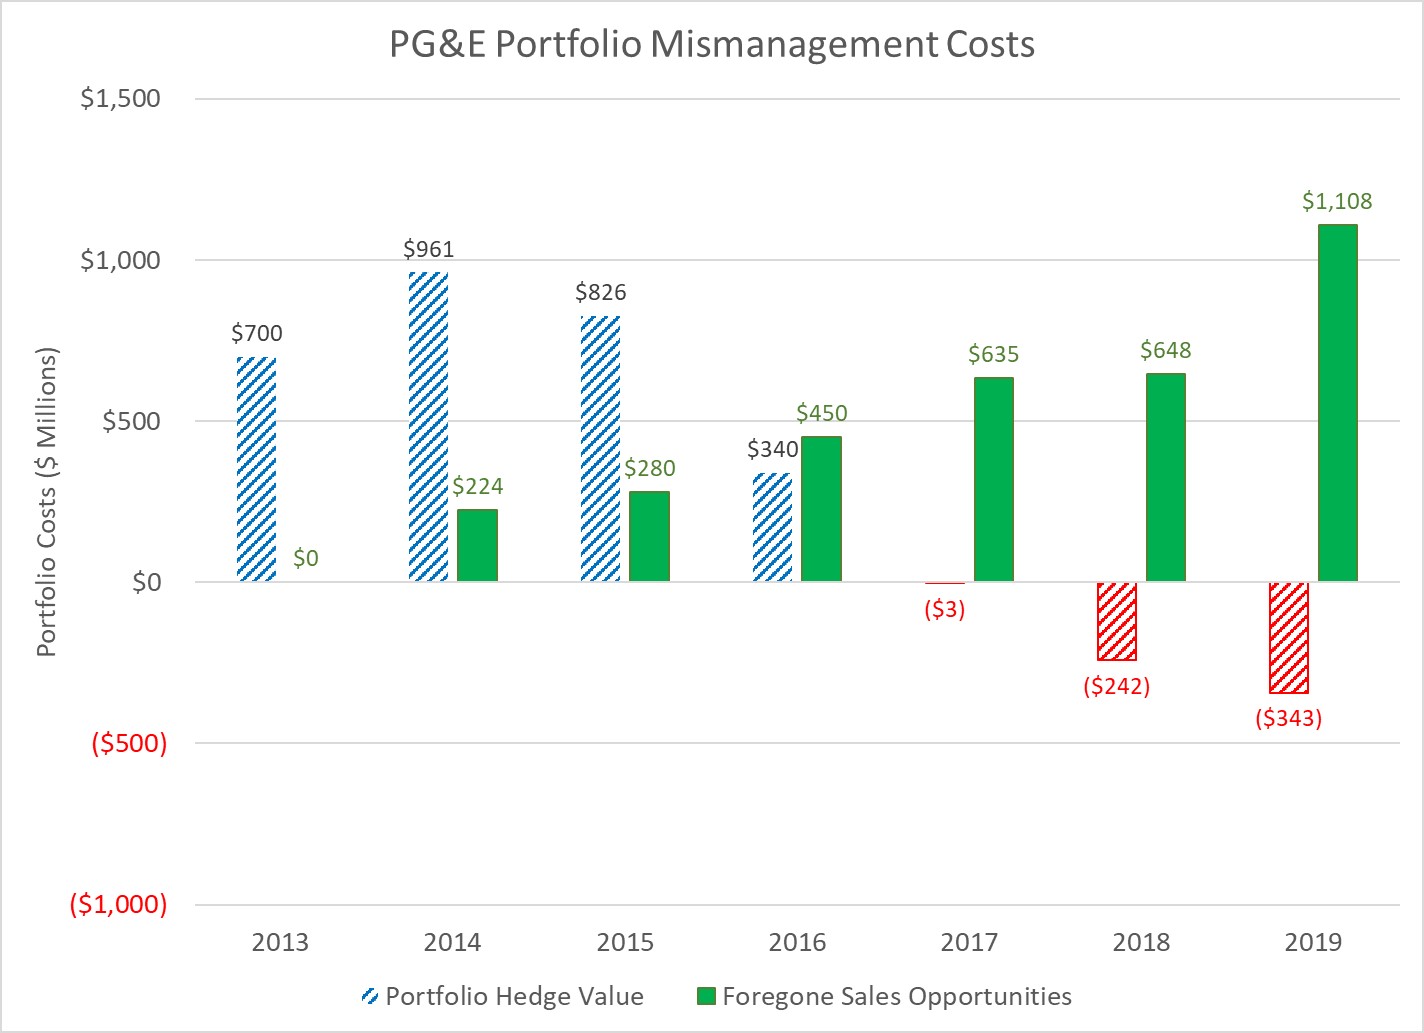
We can explore the reasons why PG&E’s rates are so high, much of which is applicable to the other two utilities as well. Starting with generation costs, PG&E’s portfolio mismanagement is not explained away with a simple assertion that the utility bought when prices were higher. In fact, PG&E failed in several ways.
First, PG&E knew about the risk of customer exit as early as 2010 as revealed during the PCIA rulemaking hearings in 2018. PG&E continued to procure as though it would be serving its entire service area instead of planning for the rise of CCAs. Further PG&E also was told as early as 2010 (in my GRC testimony) that it was consistently forecasting too high, but it didn’t bother to correct thee error. Instead, service area load is basically at the save level that it was a decade ago.
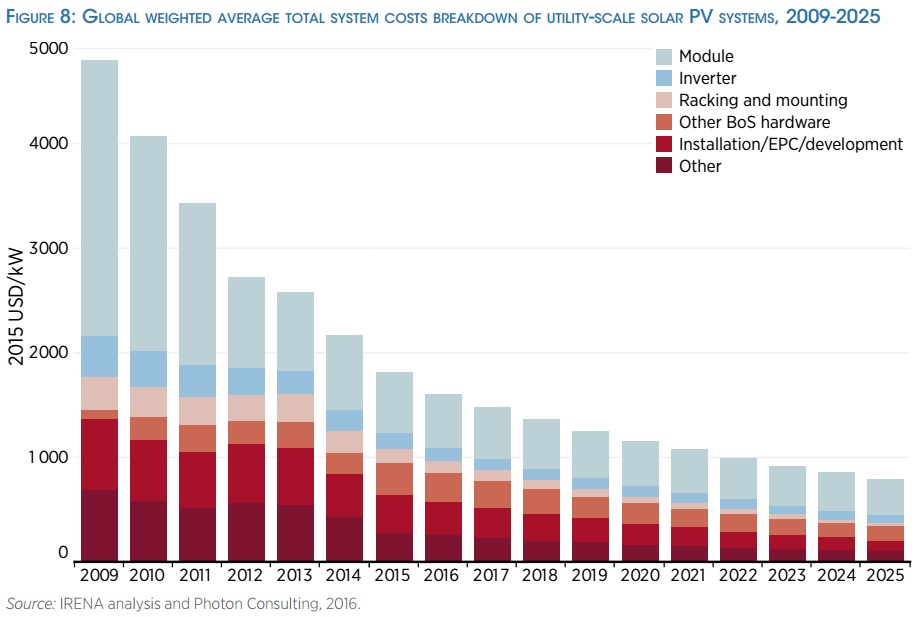
Second, PG&E could have procured in stages rather than in two large rounds of request for offers (RFOs) which it finished by 2013. By 2011 PG&E should have realized that solar costs were dropping quickly (if they had read the CEC Cost of Generation Report that I managed) and that it should have rolled out the RFOs in a manner to take advantage of that improvement. Further, they could have signed PPAs for the minimum period under state law of 10 years rather than the industry standard 30 years. PG&E was managing its portfolio in the standard practice manner which was foolish in the face of what was occurring.
Third, PG&E failed to offer part of its portfolio for sale to CCAs as they departed until 2018. Instead, PG&E could have unloaded its expensive portfolio in stages starting in 2010. The ease of the recent RPS sales illustrates that PG&E’s claims about creditworthiness and other problems had no foundation.
I calculated the what the cost of PG&E’s mismanagement has been here. While SCE and SDG&E have not faced the same degree of exit by CCAs, the same basic problems exist in their portfolios.
Another factor for PG&E is the fact that ratepayers have paid twice for Diablo Canyon. I explain here how PG&E fully recovered its initial investment costs by 1998, but as part of restructuring got to roll most of its costs back into rates. Fortunately these units retire by 2025 and rates will go down substantially as a result.
In distribution costs, both PG&E and SCE requested over $2 billion for “new growth” in each of its GRCs since 2009, despite my testimony showing that growth was not going to materialize, and did not materialize. If the growth was arising from the addition of new developments, the developers and new customers should have been paying for those additions through the line extension rules that assign that cost responsibility. The utilities’ distribution planning process is opaque. When asked for the workpapers underlying the planning process, both PG&E and SCE responded that the entirety were contained in the Word tables in each of their testimonies. The growth projections had not been reconciled with the system load forecasts until this latest GRC, so the totals of the individual planning units exceeded the projected total system growth (which was too high as well when compared to both other internal growth projections and realized growth). The result is a gross overinvestment in distribution infrastructure with substantial overcapacity in many places.
For transmission, the true incremental cost has not been fully reported which means that other cost-effective solutions, including smaller and closer renewables, have been ignored. Transmission rates have more than doubled over the last decade as a result.
The Next10 report does not appear to reflect the full value of public purpose program spending on energy efficiency, in large part because it uses a short-run estimate of marginal costs. The report similarly underestimates the value of behind-the-meter solar rooftops as well. The correct method for both is to use the market value of deferred resources–generation, transmission and distribution–when those resources were added. So for example, a solar rooftop installed in 2013 was displacing utility scale renewables that cost more than $100 per megawatt-hour. These should not be compared to the current market value of less than $60 per megawatt-hour because that investment was not made on a speculative basis–it was a contract based on embedded utility costs.