Several years ago, a friend asserted that only 25,000 Davis residents were employed out of 56,000 adults, and concluded that the city had an overwhelming number of retirees. He had pulled the data from the U.S. Census “On the Map” tool that is frequently used by planners and transportation consultants. Unfortunately, the number is wrong when compared to every other available data source. While On the Map provides correct values for neighboring cities such as Woodland and West Sacramento, the large discrepancy for Davis shows that analysts using this tool should double check their results before presenting them.
The correct number of Davis residents who are working is 31,600 to 34,000 as reported in two other Census reports, Quick Facts and the American Communities Survey (ACS), and the state’s Employment Development Department (EDD). That is a gap of 6,500 to 9,000 or 20% to 26%. The mystery is why is there such a large discrepancy?
The likely answer is that the On the Map tool is failing to account for those who work from home. The ACS shows 31,650 residents working in Davis but only 26,080 commuting to work. In another table, the ACS reports that 7,200 people work from home out of 32,800 reported as employed, which about equal to the gap between On the Map and the other data sources. A compounding factor is that On the Map shows that the contiguous University of California, Davis has 15,000 employees commuting to campus when the university reports that only 11,000 work there.[1] Davis’ unique relationship with UCD, which is not within its city limits, probably creates confusion in the underlying methodology.
Figure 1 compares four different accountings of Davis employed residents and workers. An additional source beyond the three mentioned previously is the UCD Institute of Transportation Studies’ Campus Travel Survey which has data back to 2007. Based on the UCD survey, 5,000 Davis and UCD residents work on campus, while 6,400 commute in from elsewhere (more on that later).
Figure 1

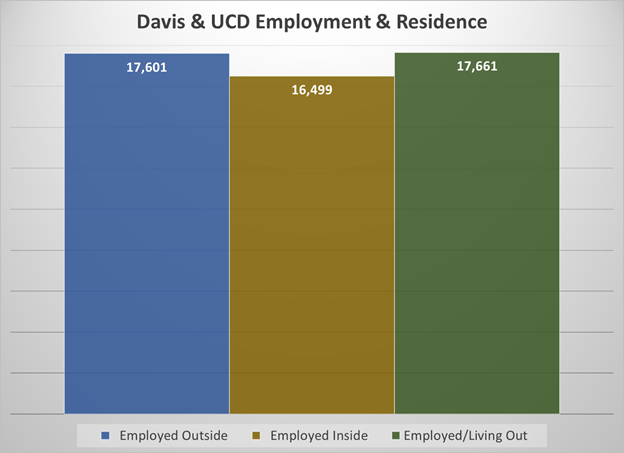
When the 5,000 UCD employees including students are added to the 4,000 who live and commute within Davis plus the 7,200 working at home, we find that 16,500 live and work within the Davis/UCD sphere. And when the 3,600 Davis residents working at UCD are subtracted from the 21,000 commuting out of the city limits, the number of actual out of town commuters is 17,600. Given the total number of jobs in the sphere is 34,150, the number of workers commuting into Davis/UCD is 17,700. Figure 2 compares these three categories which have quite similar values.
Figure 2
An important trend in the UCD Travel Survey is how much change has occurred in the number of employees live in Davis and work on campus. In 2007, almost 50% of employees lived and worked in Davis; in the latest 2023 survey, or 37% or 4,150 reside in Davis. That is a loss of 1,400 resident workers. If the percentage loss is applied to the entire Davis workforce, a reasonable assumption as a common response to higher housing prices, then Davis has lost 4,500 in-town workers since 2007.
Another valuable insight from the Travel survey is that about one-third of in-town workers commute to work via car, while 92% of out of town commuters come by car. If this pattern applies more broadly to Davis residents, then commuting traffic should decrease significantly for affordable housing built to return workers back to living in Davis.
[1] On the Map shows only 1,319 living on campus so it is clearly excluding the 20,000 plus students who reside in campus housing.