Tag Archives: transmission

The fundamental truth of marginal and average costs

Opponents of increased distributed energy resources who advocate for centralized power distribution insist that marginal costs are substantially below retail rates–as little as 6 cents per kilowatt-hour. Yet average costs generally continue to rise. For example, a claim has been repeatedly asserted that the marginal cost of transmission in California is less than a penny a kilowatt-hour. Yet PG&E’s retail transmission rate component went from 1.469 cents per kWh in 2013 to 4.787 cents in 2022. (SDG&E’s transmission rate is now 7.248 cents!) By definition, the marginal cost must be higher than 4.8 cents (and likely much higher) to increase that much.

Average costs equals the sum of marginal costs. Or inversely, marginal cost equals the incremental change in average costs when adding a unit of demand or supply. The two concepts are interlinked so that one must speak of one when speaking of the other.

The chart at the top of this post shows the relationship of marginal and average costs. Most importantly, it is not mathematically possible to have rising average costs when marginal costs are below average costs. So any assertion that transmission marginal costs are less than the average costs of transmission given that average costs are rising must be mathematically false.

Deciding if solar installation is suboptimal requires that the initial premises be specified correctly

A recent article “Heterogeneous Solar Capacity Benefits, Appropriability, and the Costs of Suboptimal Siting” in the Journal of the Association of Environmental and Resource Economists finds that distributed solar (e.g., rooftop solar) is not being installed a manner that “optimally” mitigates air pollution damages from electricity generation across the U.S. Unfortunately the paper is built on two premises that do not reflect the reality of available options and appropriate pricing signals.

First, the authors appear to be relying on the premise that sufficient solar, grid-scale or distributed, can be installed cost-effectively across the U.S. While the paper includes geographic variations in generation per installed kilowatt of capacity, it says nothing about the similarly widely varying costs per kilowatt-hour. They do not acknowledge that panels in the Pacific Northwest will cost twice that of those in the Desert Southwest. This importance of this disparity is compounded by the underestimate of the social cost of carbon and the possible conflation of sulfur dioxide and particulate matter damages. The currently accepted social cost of GHG emissions developed by the U.S. Environmental Protection Agency (US EPA) is ranges from $50 to $150 per tonne in 2030 (and recent studies have estimated that this is too low), compared to the outdated $41 per tonne in the article. Most of the SO2 damages arise from creating PM so there is likely double counting for these criteria pollutants. (The study also ignore the strong correlation between GHG and SO2 emissions as coal is the biggest source of both.) The study also fails to account for the enormous transmission costs that would be incurred moving solar output from the Desert Southwest to the Northeast to mitigate the purported damages.

Second, the authors try to claim that rooftop solar has not relieved transmission congestion by looking at grid congestion prices. The problem is that this method is like looking at an empty barn and saying a horse never lived there. Congestion pricing is based on the current transmission capacity situation. It says nothing about the history of transmission congestion or the ability and efforts to look forward to mitigate congestion. The study found that congestion prices were often negative or small in areas with substantial rooftop solar capacity. That doesn’t show that the solar capacity has little value–instead it shows that it actually relieved the congestion effectively–a completely opposite conclusion.

In contrast, the California Independent System Operator (CAISO) calculated in 2017 (contemporaneously with the article’s baseline) that at least $2.6 billion in transmission projects had been deferred. And given the utilities’ poor records on load forecasting, these savings have likely grown substantially. CAISO had anticipated and already relieved the congestion that the authors’ purported metric was searching for.

This disparity in economic results highlights the nature of investing in long-lived infrastructure that requires multiple years to build–one cannot wait for a shortfall to emerge to respond because that’s too late. Instead, one must anticipate those events and act even when its uncertain. This study is yet another example of how relying on the premise that short-run electricity market prices are reflective of long-run marginal costs is mistaken and should be set aside for policy analysis.

Has rooftop solar cost California ratepayers more than the alternatives?

The Energy Institute’s blog has an important premise–that solar rooftop customers have imposed costs on other ratepayers with few benefits. This premise runs counter to the empirical evidence.

First, these customers have deferred an enormous amount of utility-scale generation. In 2005 the CEC forecasted the 2020 CAISO peak load would 58,662 MW. The highest peak after 2006 has been 50,116 MW (in 2017–3,000 MW higher than in August 2020). That’s a savings of 8,546 MW. (Note that residential installations are two-thirds of the distributed solar installations.) The correlation of added distributed solar capacity with that peak reduction is 0.938. Even in 2020, the incremental solar DER was 72% of the peak reduction trend. We can calculate the avoided peak capacity investment from 2006 to today using the CEC’s 2011 Cost of Generation model inputs. Combustion turbines cost $1,366/kW (based on a survey of the 20 installed plants–I managed that survey) and the annual fixed charge rate was 15.3% for a cost of $209/kW-year. The total annual savings is $1.8 billion. The total revenue requirements for the three IOUs plus implied generation costs for DA and CCA LSEs in 2021 was $37 billion. So the annual savings that have accrued to ALL customers is 4.9%. Given that NEM customers are about 4% of the customer base, if those customers paid nothing, everyone else’s bill would only go up by 4% or less than what rooftop solar has saved so far.

In addition, the California Independent System Operator (CAISO) calculated in 2018 that at least $2.6 billion in transmission projects had been deferred through installed distributed solar. Using the amount installed in 2017 of 6,785 MW, the avoided costs are $383/kW or $59/kW-year. This translates to an additional $400 million per year or about 1.1% of utility revenues.

The total savings to customers is over $2.2 billion or about 6% of revenue requirements.

Second, rooftop solar isn’t the most expensive power source. My rooftop system installed in 2017 costs 12.6 cents/kWh (financed separately from our mortgage). In comparison, PG&E’s RPS portfolio cost over 12 cents/kWh in 2019 according to the CPUC’s 2020 Padilla Report, plus there’s an increments transmission cost approaching 4 cents/kWh, so we’re looking at a total delivered cost of 16 cents/kwh for existing renewables. (Note that the system costs to integrate solar are largely the same whether they are utility scale or distributed).

Comparing to the average IOU RPS portfolio cost to that of rooftop solar is appropriate from the perspective of a customer. Utility customers see average, not marginal, costs and average cost pricing is widely prevalent in our economy. To achieve 100% renewable power a reasonable customer will look at average utility costs for the same type of power. We use the same principle by posting on energy efficient appliances the expect bill savings based on utility rates–-not on the marginal resource acquisition costs for the utilities.

And customers who would choose to respond to the marginal cost of new utility power instead will never really see those economic savings because the supposed savings created by that decision will be diffused across all customers. In other words, other customers will extract all of the positive rents created by that choice. We could allow for bypass pricing (which industrial customers get if they threaten to leave the service area) but currently we force other customers to bear the costs of this type of pricing, not shareholders as would occur in other industries. Individual customers are currently the decision making point of view for most energy use purposes and they base those on average cost pricing, so why should we have a single carve out for a special case that is quite similar to energy efficiency?

I wrote more about whether a fixed connection cost is appropriate for NEM customers and the complexity of calculating that charge earlier this week.

The scale economy myth of electric utilities

Vibrant Clean Energy released a study showing that inclusion of large amounts of distributed energy resources (DERs) can lower the costs of achieving 100% renewable energy. Commentors here have criticized the study for several reasons, some with reference to the supposed economies of scale of the grid.

While economies of scale might hold for individual customers in the short run, the data I’ve been evaluating for the PG&E and SCE general rate cases aren’t necessarily consistent with that notion. I’ve already discussed here the analysis I conducted in both the CAISO and PJM systems that show marginal transmission costs that are twice the current transmission rates. The rapid rise in those rates over the last decade are consistent with this finding. If economies of scale did hold for the transmission network, those rates should be stable or falling.

On the distribution side, the added investment reported in those two utilities’ FERC Form 1 are not consistent with the marginal costs used in the GRC filings. For example the added investment reported in Form 1 for final service lines (transmission, services, meters or TSM) appears to be almost 10 times larger than what is implied by the marginal costs and new customers in the GRC filings. And again the average cost of distribution is rising while energy and peak loads have been flat across the CAISO area since 2006. The utilities have repeatedly asked for $2 billion each GRC for “growth” in distribution, but given the fact that load has been flat (and even declining in 2019 and 2020), that means there’s likely a significant amount of stranded distribution infrastructure. If that incremental investment is for replacement (which is not consistent with either their depreciation schedules or their assertions about the true life of their facilties and the replacement costs within their marginal cost estimates), then they are grossly underestimating the future replacement cost for facilities which means they are underestimating the true marginal costs.

I can see a future replacement liability right outside my window. The electric poles were installed by PG&E 60+ years ago and the poles are likely reaching the end of their lives. I can see the next step moving to undergrounding the lines at a cost of $15,000 to $25,000 per house based on the ongoing mobilehome conversion program and the typical Rule 20 undergrounding project. Deferring that cost is a valid DER value. We will have to replace many services over the next several decades. And that doesn’t address the higher voltage parts of the system.

We have a counterexample of a supposed monopoly in the cable/internet system. I have at least two competing options where I live. The cell phone network also turned out not to be a natural monopoly. In an area where the PG&E and Merced ID service territories overlap, there are parallel distribution systems. The claim of a “natural monopoly” more likely is a legal fiction that protects the incumbent utility and is simpler for local officials to manage when awarding franchises.

If the claim of natural monopolies in electricity were true, then the distribution rate components for SCE and PG&E should be much lower than for smaller munis such as Palo Alto or Alameda. But that’s not the case. The cost advantages for SMUD and Roseville are larger than can be simply explained by differences in cost of capital. The Division/Office of Ratepayer Advocates commissioned a study by Christensen Associates for PG&E’s 1999 GRC that showed that the optimal utility size was about 500,000 customers. (PG&E’s witness who was a professor at UC Berkeley inadvertently confirmed the results and Commissioner Richard Bilas, a Ph.D. economist, noted this in his proposed decision which was never adopted because it was short circuited by restructuring.) Given that finding, that means that the true marginal cost of a customer and associated infrastructure is higher than the average cost. The likely counterbalancing cause is an organizational diseconomy of scale that overwhelms the technological benefits of size.

Finally, generation no longer shows the economies of scale that dominated the industry. The modularity of combined cycle plants and the efficiency improvement of CTs started the industry down the rode toward the efficiency of “smallness.” Solar plants are similarly modular. The reason why additional solar generation appears so low cost is because much of that is from adding another set of panels to an existing plant while avoiding additional transmission interconnection costs (which is the lion’s share of the costs that create what economies of scale do exist.)

The VCE analysis looks a holistic long term analysis. It relies on long run marginal costs, not the short run MCs that will never converge on the LRMC due to the attributes of the electricity system as it is regulated. The study should be evaluated in that context.

Part 2: A response to “Is Rooftop Solar Just Like Energy Efficiency?”

Severin Borenstein at the Energy Institute at Haas has written another blog post asserting that solar rooftop rates are inefficient and must changed radically. (I previously responded to an earlier post.) When looking at the efficiency of NEM rates, we need to look carefully at several elements of electricity market and the overall efficiency of utility ratemaking. We can see that we can come to a very different conclusion.

I filed testimony in the NEM 3.0 rulemaking last month where I calculated the incremental cost of transmission investment for new generation and the reduction in the CAISO peak load that looks to be attributable to solar rooftop.

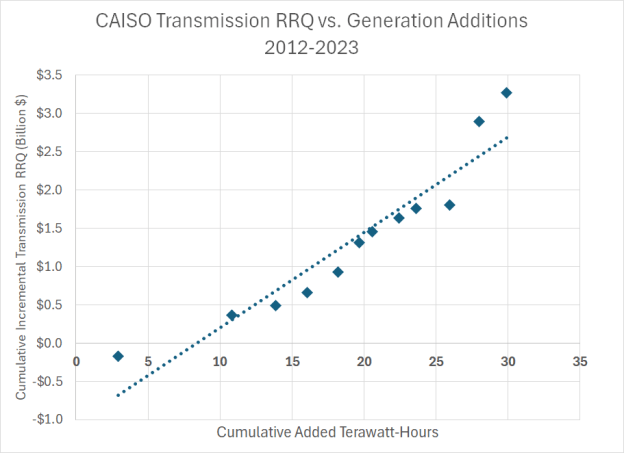
  • Using FERC Form 1 and CEC powerplant data, I calculated that the incremental cost of transmission is $37/MWH. (And this is conservative due to a couple of assumptions I made.) Interestingly, I had done a similar calculation for AEP in the PJM interconnect and also came up with $37/MWH. This seems to be a robust value in the right neighborhood.
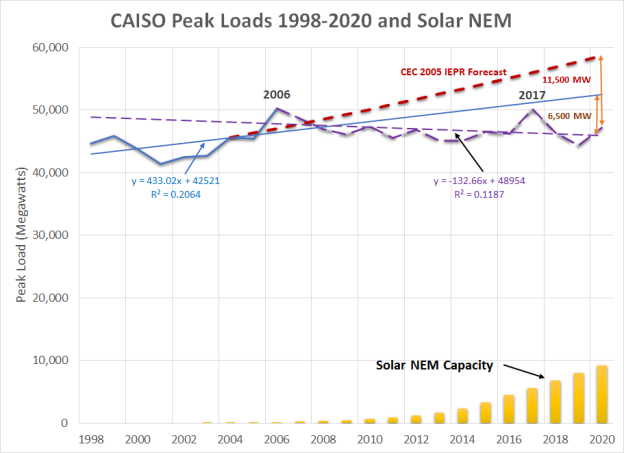
  • Load growth in California took a distinct change in trend in 2006 just as solar rooftop installations gained momentum. I found a 0.93 correlation between this change in trend and the amount of rooftop capacity installed. Using a simple trend, I calculated that the CAISO load decreased 6,000 MW with installation of 9,000 MW of rooftop solar. Looking at the 2005 CEC IEPR forecast, the peak reduction could be as large as 11,000 MW. CAISO also estimated in 2018 that rooftop solar displaced in $2.6 billion in transmission investment.

When we look at the utilities’ cost to acquire renewables and add in the cost of transmission, we see that the claim that grid-scale solar is so much cheaper than residential rooftop isn’t valid. The “green” market price benchmark used to set the PCIA shows that the average new RPS contract price in 2016 was still $92/MWH in 2016 and $74/MWH in 2017. These prices generally were for 30 year contracts, so the appropriate metric for comparing a NEM investment is against the vintage of RPS contracts signed in the year the rooftop project was installed. For 2016, adding in the transmission cost of $37/MWH, the comparable value is $129/MWH and in 2017, $111/MWH. In 2016, the average retail rates were $149/MWH for SCE, $183/MWH for PG&E and $205/MWH for SDG&E. (Note that PG&E’s rate had jumped $20/MWH in 2 years, while SCE’s had fallen $20/MWH.) In a “rough justice” way, the value of the displaced energy via rooftop solar was comparable to the retail rates which reflect the value of power to a customer, at least for NEM 1.0 and 2.0 customers. Rooftop solar was not “multiples” of grid scale solar.

These customers also took on investment risk. I calculated the payback period for a couple of customers around 2016 and found that a positive payback was dependent on utility rates rising at least 3% a year. This was not a foregone conclusion at the time because retail rates had actually be falling up to 2013 and new RPS contract prices were falling as well. No one was proposing to guarantee that these customers recover their investments if they made a mistake. That they are now instead benefiting is unwarranted hubris that ignores the flip side of the importance of investment risk–that investors who make a good efficient decision should reap the benefits. (We can discuss whether the magnitude of those benefits are fully warranted, but that’s a different one about distribution of income and wealth, not efficiency.)

Claiming that grid costs are fixed immutable amount simply isn’t a valid claim. SCE has been trying unsuccessfully to enact a “grid charge” with this claim since at least 2006. The intervening parties have successfully shown that grid costs in fact are responsive to reductions in demand. In addition, moving to a grid charge that creates a “ratchet effect” in revenue requirements where once a utility puts infrastructure in place, it faces no risk for poor investment decisions. On the other hand the utility can place its costs into ratebase and raise rates, which then raises the ratchet level on the fixed charge. One of the most important elements of a market economy that leads to efficient investment is that investors face the risk of not earning a return on an investment. That forces them to make prudent decisions. A “ratcheted” grid charge removes this risk even further for utilities. If we’re claiming that we are creating an “efficient” pricing policy, then we need to consider all sides of the equation.

The point that 50% of rooftop solar generation is used to offset internal use is important–while it may not be exactly like energy efficiency, it does have the most critical element of energy efficiency. That there are additional requirements to implement this is of second order importance, Otherwise we would think of demand response that uses dispatch controls as similarly distinct from EE. Those programs also require additional equipment and different rates. But in fact we sum those energy savings with LED bulbs and refrigerators.

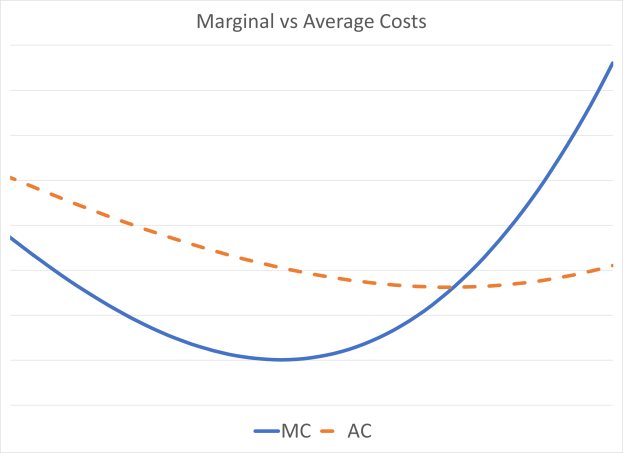
An important element of the remaining 50% that is exported is that almost all of it is absorbed by neighboring houses and businesses on the same local circuit. Little of the power goes past the transformer at the top of the circuit. The primary voltage and transmission systems are largely unused. The excess capacity that remains on the system is now available for other customers to use. Whether investors should be able to recover their investment at the same annual rate in the face of excess capacity is an important question–in a competitive industry, the effective recovery rate would slow.

Finally, public purpose program (PPP) and wildfire mitigation costs are special cases that can be simply rolled up with other utility costs.

  • The majority of PPP charges are a form of a tax intended for income redistribution. That function is admirable, but it shows the standard problem of relying on a form of a sales tax to finance such programs. A sales tax discourages purchases which then reduces the revenues available for income transfers, which then forces an increase in the sales tax. It’s time to stop financing the CARE and FERA programs from utility rates.
  • Wildfire costs are created by a very specific subclass of customers who live in certain rural and wildlands-urban interface (WUI) areas. Those customers already received largely subsidized line extensions to install service and now we are unwilling to charge them the full cost of protecting their buildings. Once the state made the decision to socialize those costs instead, the costs became the responsibility of everyone, not just electricity customers. That means that these costs should be financed through taxes, not rates.

Again, if we are trying to make efficient policy, we need to look at the whole. It is is inefficient to finance these public costs through rates and it is incorrect to assert that there is an inefficient subsidy created if a set of customers are avoiding paying these rate components.

Transmission: the hidden cost of generation

The cost of transmission for new generation has become a more salient issue. The CAISO found that distributed generation (DG) had displaced $2.6 billion in transmission investment by 2018. The value of displacing transmission requirements can be determined from the utilities’ filings with FERC and the accounting for new power plant capacity. Using similar methodologies for calculating this cost in California and Kentucky, the incremental cost in both independent system operators (ISO) is $37 per megawatt-hour or 3.7 cents per kilowatt-hour in both areas. This added cost about doubles the cost of utility-scale renewables compared to distributed generation.

When solar rooftop displaces utility generation, particularly during peak load periods, it also displaces the associated transmission that interconnects the plant and transmits that power to the local grid. And because power plants compete with each other for space on the transmission grid, the reduction in bulk power generation opens up that grid to send power from other plants to other customers.

The incremental cost of new transmission is determined by the installation of new generation capacity as transmission delivers power to substations before it is then distributed to customers. This incremental cost represents the long-term value of displaced transmission. This amount should be used to calculate the net benefits for net energy metered (NEM) customers who avoid the need for additional transmission investment by providing local resources rather than remote bulk generation when setting rates for rooftop solar in the NEM tariff.

  • In California, transmission investment additions were collected from the FERC Form 1 filings for 2017 to 2020 for PG&E, SCE and SDG&E. The Wholesale Base Total Revenue Requirements submitted to FERC were collected for the three utilities for the same period. The average fixed charge rate for the Wholesale Base Total Revenue Requirements was 12.1% over that year. That fixed charge rate is applied to the average of the transmission additions to determine the average incremental revenue requirements for new transmission for the period. The plant capacity installed in California for 2017 to 2020 is calculated from the California Energy Commission’s ā€œAnnual Generation – Plant Unitā€. (This metric is conservative because (1) it includes the entire state while CAISO serves only 80% of the state’s load and the three utilities serve a subset of that, and (2) the list of ā€œnewā€ plants includes a number of repowered natural gas plants at sites with already existing transmission. A more refined analysis would find an even higher incremental transmission cost.)

Based on this analysis, the appropriate marginal transmission cost is $171.17 per kilowatt-year. Applying the average CAISO load factor of 52%, the marginal cost equals $37.54 per megawatt-hour.

  • In Kentucky, Kentucky Power is owned by American Electric Power (AEP) which operates in the PJM ISO. PJM has a market in financial transmission rights (FTR) that values relieving the congestion on the grid in the short term. AEP files network service rates each year with PJM and FERC. The rate more than doubled over 2018 to 2021 at average annual increase of 26%.

Based on the addition of 22,907 megawatts of generation capacity in PJM over that period, the incremental cost of transmission was $196 per kilowatt-year or nearly four times the current AEP transmission rate. This equates to about $37 per megawatt-hour (or 3.7 cents per kilowatt-hour).

Public takeover of PG&E isn’t going to solve every problem

This article in the Los Angeles Times about what a public takeover of PG&E appears to take on uses the premise that such a step would lead to lower costs, more efficiencies and reduced wildfire risks. These expectations have never been realistic, and shouldn’t be the motivation for such an action. Instead, a public takeover would offer these benefits and opportunities:

  • While the direct costs of constructing and repairing the grid would likely be about the same (and PG&E has some of the highest labor costs around), the cost to borrow and invest the needed funds would be as much as 30% less. That’s because PG&E weighted average cost of capital (debt and shareholder equity) is around 8% per annum while muncipal debt is 5% or less.
  • Ratepayers are already repaying shareholders and creditors for their investments in the utility system. Buying PG&E’s system would simply be replacing those payments with payments to creditors that hold public bonds. Similar to the cost of fixing the grid, this purchase should reduce the annual cost to repay that debt by 30%.
  • And along these lines, utility shareholders have borne little of the costs from these types of risks. Shareholders supposedly get a premium on their investment returns for these “risks” but when asked for examples of large scale disallowances, none of the utilities could provide significant examples. If ratepayers are already bearing all of those risks, then they should get all of the investment benefits as well.
  • Direct public oversight will eliminate a layer of regulation that PG&E has used to impede effective oversight and deflect responsibility. To some extent regulation by the California Public Utilities Commission has been like pushing on a string, with PG&E doing what it wants by “interpreting” CPUC decisions. The result has been a series of missteps by the utility over many decades.
  • A new utility structure may provide an opportunity to renegotiate a number of overly lucrative renewable power purchase agreements that PG&E signed between 2010 and 2015. PG&E failed to properly manage the risk profile of its portfolio because under state law it could pass through all costs of those PPAs once approved by the CPUC. PG&E’s shareholders bore no risk, so why consider that risk? There are several possible options to addressing this issue, but PG&E has little incentive to act.
  • A publicly-owned utility can work more closely with local governments to facilitate the evolution of the energy system to meet climate change challenges. As a private entity with restrictions on how it can participate in customer-side energy management, PG&E cannot work hand-in-glove with cities and counties on building and transportation transformation. PG&E right now has strong incentives to prevent further defections away from its grid; public utilities are more likely to accept these defections with the possibility that the stranded asset costs will be socialized.

The risks of wildfire damages and liabilities are unlikely to change substantially (except if the last point accelerates distributed energy resource investment). But the other benefits and opportunities are likely to make these costs lower.