Tag Archives: innnovation

Will Amazon’s HQ2 pay off for New York?

11302017_amazon-slu_080727-780x490

Even though I have conducted regional economic impact studies, I’m always a bit skeptical when a project is touted as a huge payoff for taxpayer investment. Amazon’s HQ2 is a case in point. New York is claiming a $24 billion net return over 25 years from the $3.6 billion in tax breaks, based on impact analysis done with the REMI economic model. I would be interested in a retrospective analysis on the impact of Amazon’s HQ1 in Seattle. The campus is fairly self contained and it should be fairly straightforward to track the growth of Amazon employment in Seattle since the last 1990s. Clearly, there would be uncertainty about how to attribute regional economic activity to Amazon activity, but we could see bounds on various factors such as jobs and tax revenues. We could then see a comparison against the estimates for New York City.

Make “Sustainable Food” the Economic Engine of Downtown Davis


innovation-for-sustainable-food-and-agriculture-11-638

Many communities around the region, such as Sacramento and Woodland, have jumped on the “farm to fork” bandwagon to promote their relationships with agriculture. Davis can distinguish itself from the crowd by taking this a step further to promote itself as the center of “sustainable food.” In doing this, Davis can develop placemaking that is the key to economic development and vitality.

Davis is home to one of the top-rated food production research universities in the world in UC Davis. The City of Davis should leverage this position and strengthen its relationship to reinvigorate the downtown. The City has an opportunity as part of its Downtown Davis or Core Area Specific Plan to define a vision to achieve that goal.

Sustainable food minimizes damages to the planet in its cultivation, production, preparation, consumption and disposal. It is largely plant-based because this is the most direct way to deliver calories and protein to our diets. Animal production has much higher waste products, resource consumption, greenhouse gas emissions, and tainted food per calorie or gram of protein. For example, based on U.S. Department of Agriculture statistics, beef production emits four times as much greenhouse gases (GHGs) per calorie than soybeans or wheat and twice as much GHGs per gram of protein. Given California’s goal to be a “net carbon zero” emitter by 2045, the state will need to take a wide range of steps to cut emissions across the board, including in food production and consumption. Sustainable food is also more ethically consistent and healthful than our current food production and consumption patterns.

Sustainable food has been in the press frequently of late, with numerous stories in the Bay Area media. San Francisco has become the venture capital center of the world—especially for sustainable food–but real estate is becoming too expensive there to allow an industry that focuses on physical products sufficient space. Davis is close enough to that center for easy communication, but still has comparatively inexpensive land.

Creating a sustainable food ecology in Davis would have five aspects:

  1. Supporting innovation in sustainable food production and distribution
  2. Providing sustainable infrastructure to support companies that are innovating
  3. Serving and delivering sustainable food locally
  4. Preparing food that is consumed locally in a sustainable manner
  5. Attracting sustainable food-oriented tourism

The City can focus development of a sustainable food industry hub in the “Flex District” proposed for the G Street Corridor in the Downtown Plan. This area could house a wider range of facilities, such as test labs, within easy access distance of the UCD campus and the Capitol Corridor train to the Bay Area. Larger research facilities can be housed in other parts of the City where larger, industrial facilities are more appropriate.

Part of the attraction to companies locating here could be a sustainable infrastructure configuration starting in this district, with a district energy network and electric microgrid supporting fully electrified space conditioning and water heating systems. The other sustainability attributes identified in the Downtown Davis Plan should be incorporated and highlighted.

We can also encourage existing restaurants to serve more sustainable food on their menus, and attract new restaurants to cater to the new sustainable food businesses and their employees. The investors and workers at these companies are much more likely to follow their ethical beliefs in their consumption choices. The City could provide incentives through reduced fees to existing businesses, and evaluate how to speed the start up of new businesses.

As part of establishing a sustainable environment, the City should facilitate switching restaurants to more sustainable preparation practices. This includes switching from natural gas to induction cooktops and convection ovens, district water heating and space conditioning, and better management of waste. (Yes, we may need to recruit chefs for this new challenge.)

Finally, Davis can become a sustainable food destination. Less than 20% of our downtown visitors are from out of town according to analysis by consultants to City working on the Downtown Davis Plan. Given our location on the Capitol Corridor train route and Interstate 80, the community has much room for growth in tourism to boost our economy beyond UCD students’ parents visiting in September and June.

Davis already has a core attraction in its world-famous Farmers’ Market. With the addition of plant-based oriented restaurants and closer integration with the Mondavi Center entertainment area, a visitor could easily spend a whole day in Davis with a quick trip on the train from the Bay Area. Implementing this vision just needs closer coordination with UCD to bring events to Mondavi and the new Shrem Art Museum on Saturdays and setting up an electric bus shuttle between there and downtown.

UCD’s Robert Mondavi Institute for Wine and Food Sciences provides an example of how local development can be both sustainable and invigorating. That locale now has a microgrid that relies on renewable power. Both UCD and the City could benefit from a closer relationship centered around sustainable food in several dimensions.

Implementing all of this vision requires going beyond the form-based zoning codes that will come out of the Core Area Specific Plan. The City needs a comprehensive economic development plan, direction and resources for its economic development staff, and a willingness to focus on removing the barriers to bringing and supporting these businesses in Davis.

(with Anya McCann, COOL Cuisine)

Why increasing wealth concentration is bad for the U.S. economy

figure-1-e1455723650211

recent article in the New York Times by Dierdre McCloskey boldly states that the answer to income inequality is to allow unfettered growth through free market forces. Unfortunately, this thesis comes straight out of the anti-Communist 1950s. McCloskey puts up a strawman that proponents of addressing inequality directly want to redistribute all wealth via grabbing all assets of the wealthy. Her version of how the economy has worked, and the policy proposals to address inequality are incorrect.

As I posted previously, we’ve already run the experiment comparing the performance of a market-based economy (West Germany) to a centrally-planned socialist economy (East Germany), and the market-based more than doubled the output of the socialist one. That said, the past West German (and the current German) is a far cry from a “free market” economy. It was and is heavily regulated with substantial redistributive policies. No one is seriously advocating that the U.S. move to a Communist economy (at least not since the 1950s)–they are suggesting that the U.S. consider policies that could redistribute wealth to improve the welfare of almost everyone.

Increased inequality has been found to decrease economic growth, contrary to McCloskey’s implied assertion. Both the OECD and IMF found negative consequences from increased wealth in the top 20% of households. Other studies show that historic U.S. GDP growth has not been impeded by high marginal tax rates, either for individual or corporate taxes.

She also misses the real reason as to why inequality is a concern. She dismisses it as simple envy. But it’s really about relative political and economic power. The wealthy are able to exert more bargaining power in economic transactions, and their greater influence on the political process is well documented.

As a side note, McCloskey appears to grossly underestimating the share of wealth and income held by the wealthiest segment of U.S. society. Her calculation appears to assume that wealth is distributed evenly across all of the income quintiles (“If we took every dime from the top 20 percent of the income distribution and gave it to the bottom 80 percent, the bottom folk would be only 25 percent better off.”) In fact, a recent estimate by the Federal Reserve Board shows that the top 0.1% of U.S. households hold over 40% of the wealth. That means that redistributing the wealth of just 0.1% will lead to a 40% increase in the wealth of everyone else. I’m not advocating such a radical solution, but it does demonstrate the potential scale of redistributive policies. For example, redistributing just 25% of the wealth of the richest 1% could lead to a 10% increase in the wealth of the remaining 99.9%.


When is $100 billion not that big?

bg-red-tape-rising-2016-chart-1-825

When it’s measured against $18,675 billion ($18.7 trillion) produced by the U.S. economy. The Heritage Foundation issued a report claiming the Obama Administration imposed $107 billion in new burdens over seven years. That sounds like a huge amount, but that’s only 0.6% (six-tenths of a percent) of the economy. And that’s spread over seven years which means that this the reduction in the GDP growth rate was only 0.08% (eight hundredths of a percent) per year. Against an annual average growth rate of over 2%, that’s a trivial amount. Another way to think of it is this way: if you had a dinner bill from Applebee’s for $19, would you not by dinner it if cost a dime more? Probably not–you wouldn’t even notice.

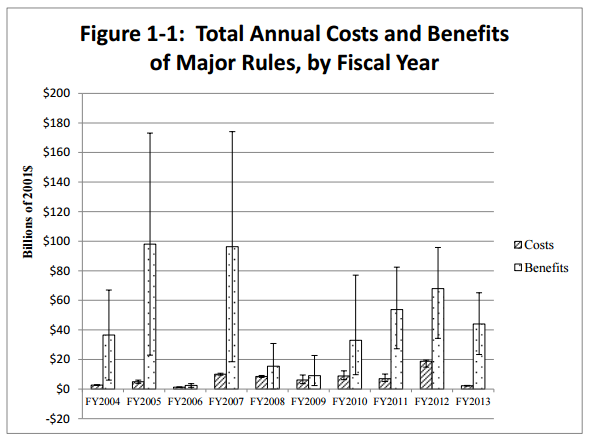
Plus, the HF’s estimate ignores the benefits of those regulations. This graphic from the OMB that shows the estimated relative benefits to costs of regulation.

omb

I won’t dig too deeply into the Heritage Foundation’s analysis other than to make a couple of notes about about alternative perspectives that I am familiar with:

  • Heritage Foundation claims that the Clean Power Plan has cost $7.2 billion as the single largest increment. Yet Lawrence Berkeley National Laboratory (which is much better qualified on this issue than the HF) just released a study showing the net financial “costs” of the various renewable portfolio standard (RPS) requirements is actually a benefit $47 to $109 billion. (And that ignores the environmental benefits identified in the report.)
  • After the 2008 financial debacle, the industry was going to face increased regulation to reign in its behavior during the previous decade. So increased regulation under Dodd-Frank is to be expected. And the better question might be what is the drag on the economy from high financial-related transaction costs? One study found that transaction costs may be as high at 45% in the U.S. economy. The financial and legal sectors likely are a bigger drag than government regulation.
  • On FCC net neutrality, see a previous post about how bigger corporations and economic concentration reduces innovation, which leads to reduced growth. Net neutrality is intended to fight that concentration.

Innovation explains manufacturing job losses, not “bad trade deals”

manuf-jobsvoutput

Much was made during the Presidential campaign of manufacturing jobs being “exported” due to unfavorable trade pacts. Yet when we look at the data since 1960, we don’t see evidence for this claim. If jobs were being exported, then manufacturing output associated with those jobs would be leaving to. Instead, as shown above, we see that manufacturing output (and value added which is the value added to production inputs, e.g., the car value after paying for the iron, aluminum, rubber and plastic) has grown steadily with momentary dips for recessions in 1981, 2001 and 2008. Meanwhile manufacturing jobs remained fairly stable from the peak in 1979 to 2001. And then the bottom fell out: employment fell one-third from 2000 to 2009.

manuf-growthcomps

So if those jobs weren’t exported (obviously since the output growth was largely unchanged), then what might have happened? The chart above provides one explanation: Technological innovation replaced those jobs. The chart compares a rolling five-year average of productivity gains (measured as output per job) to sector job growth. Productivity growth had an early peak in the 1970s that coincided with the flattening of job growth through the 1990s. Then in 2001 productivity growth begins to rise to a new peak just before the Great Recession and manufacturing job growth plunges to new depths. (Note that this contrasts with the decline in overall productivity cited by the St. Louis Federal Reserve Bank that I posted.) Only in the last couple of years has the sector brought back jobs in the recovery.

Data from the countries where the U.S. has supposedly “exported” jobs in fact reinforces this point–they are also losing manufacturing jobs. The simple truth is that, as happened with agriculture at the turn of the 20th century, increased productivity means that fewer jobs are needed to make ever more goods. We could never feed everyone in the world if we had stopped innovation in farming in 1900; change was inevitable and largely beneficial. We can never return to the “good old days.”

Instead of trying to stop the future, we need to turn our attention to how we help those left behind by these changes. In 1900, farmers were able to move to the cities and find jobs that paid better than their farmwork. This time around, that doesn’t seem to be the case–we can’t just “leave it to the market.”


Reblog: Why Tim Cook is Steve Ballmer and why he still has his job at Apple • The Berkeley Blog

This post seems particularly apt for the electricity industry. IOU CEOs typically are “executioners” not “visionaries,” and this is at the heart of their existential conumdrum.

What happens to a company when a visionary CEO is gone? Most often innovation dies and the company coasts for years on momentum and its brand. Rarely does it regain its former glory. Here’s why. Mi…

Source: Why Tim Cook is Steve Ballmer and why he still has his job at Apple • The Berkeley Blog

Reblog: Paul Brown on the “optimization trap” and innovation | MAVEN’S NOTEBOOK

Paul Brown talks about how chasing “optimization” is a fruitless distraction, which I happen to agree with. We should be focused on exploring the consequences of different pathways and how to mitigate significant vulnerabilities.

Source: WATER SMART INNOVATIONS: Speeding up innovation in the water industry | MAVEN’S NOTEBOOK | Water news