Tag Archives: agriculture

Why are we punishing customers for doing the right thing?

The saying goes “No good deed goes unpunished.” The California Public Utilities Commission seems to have taken that motto to heart recently, and stands ready to penalize yet another group of customers who answered the clarion call to help solve the state’s problems by radically altering the rules for solar rooftops. Here’s three case studies of recent CPUC actions that undermine incentives for customers to act in the future in response to state initiatives: (1) farmers who invested in response to price incentives, (2) communities that pursued renewables more assertively, and (3) customers who installed solar panels.

Agriculture: Farmers have responded to past time of use (TOU) rate incentives more consistently and enthusiastically than any other customer class. Instead of being rewarded for their consistency, their peak price periods shifted from the afternoon to the early evening. Growers face much more difficulty in avoiding pumping during that latter period.

Since TOU rates were introduced to agricultural customers in the late 1970s, growers have made significant operational changes in response to TOU differentials between peak and off-peak energy prices to minimize their on-peak consumption. These include significant investments in irrigation equipment, storage and conveyance infrastructure and labor deployment rescheduling. The results of these expenditures are illustrated in the figure below, which shows how agricultural loads compare with system-wide load on a peak summer weekday in 2015, contrasting hourly loads to the load at the coincident peak hour. Both the smaller and larger agricultural accounts perform better than a range of representative rate schedules. Most notably agriculture’s aggregate load shape on a summer weekday is inverted relative to system peak, i.e., the highest agricultural loads occur during the lowest system load periods, in contrast with other rate classes.

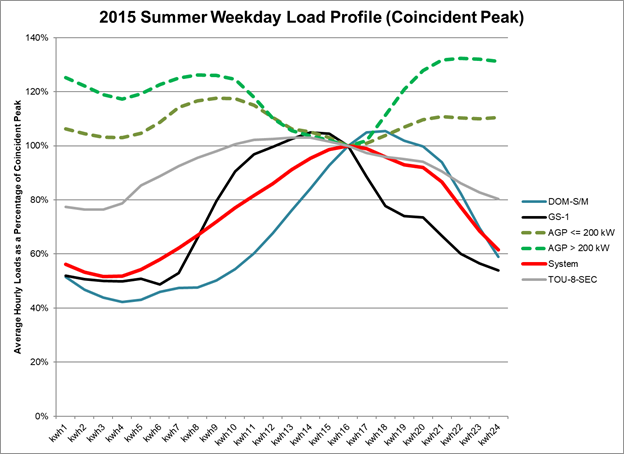
All other rate schedules shown in the graphic hit their annual peak on the same peak day within the then-applicable peak hours of noon to 6 p.m. In contrast, agriculture electricity demand is less than 80% of its annual peak during those high-load hours, with its daily peak falling outside the peak period. Agriculture’s avoidance of peak hours occurred during the summer agricultural growing season, which coincided with peak system demand—just as the Commission asked customers to do. The Commission could not ask for a better aggregate response to system needs; in contrast to the profiles for all of the other customer groups, agriculture has significantly contributed to shifting the peak to a lower cost evening period.

The significant changes in the peak period price timing and differential that the CPUC adopted increases uncertainty over whether large investments in high water-use efficiency microdrip systems – which typically cost $2,000 per acre–will be financially viable. Microdrip systems have been adopted widely by growers over the last several years—one recent study of tomato irrigation rates in Fresno County could not find any significant quantity of other types of irrigation systems. Such systems can be subject to blockages and leaks that are only detectable at start up in daylight. Growers were able to start overnight irrigation at 6 p.m. under the legacy TOU periods and avoid peak energy use. In addition, workers are able to end their day shortly after 6 p.m. and avoid nighttime accidents. Shifting that load out of the peak period will be much more difficult to do with the peak period ending after sunset.

Contrary to strong Commission direction to incent customers to avoid peak power usage, the shift in TOU periods has served to penalize, and reverse, the great strides the agricultural class has made benefiting the utility system over the last four decades.

Community choice aggregators: CCAs were created, among other reasons, to develop more renewable or “green” power. The state achieved its 2020 target of 33% in large part because of the efforts of CCAs fostered through offerings of 50% and 100% green power to retail customers. CCAs also have offered a range of innovative programs that go beyond the offerings of PG&E, SCE and SDG&E.

Nevertheless, the difficulty of reaching clean energy goals is created by the current structure of the PCIA. The PCIA varies inversely with the market prices in the market–as market prices rise, the PCIA charged to CCAs and direct access (DA) customers decreases. For these customers, their overall retail rate is largely hedged against variation and risk through this inverse relationship.

The portfolios of the incumbent utilities are dominated by long-term contracts with renewables and capital-intensive utility-owned generation. For example, PG&E is paying a risk premium of nearly 2 cents per kilowatt-hour for its investment in these resources. These portfolios are largely impervious to market price swings now, but at a significant cost. The PCIA passes along this hedge through the PCIA to CCAs and DA customers which discourages those latter customers from making their own long term investments. (I wrote earlier about how this mechanism discouraged investment in new capacity for reliability purposes to provide resource adequacy.)

The legacy utilities are not in a position to acquire new renewables–they are forecasting falling loads and decreasing customers as CCAs grow. So the state cannot look to those utilities to meet California’s ambitious goals–it must incentivize CCAs with that task. The CCAs are already game, with many of them offering much more aggressive “green power” options to their customers than PG&E, SCE or SDG&E.

But CCAs place themselves at greater financial risk under the current rules if they sign more long-term contracts. If market prices fall, they must bear the risk of overpaying for both the legacy utility’s portfolio and their own.

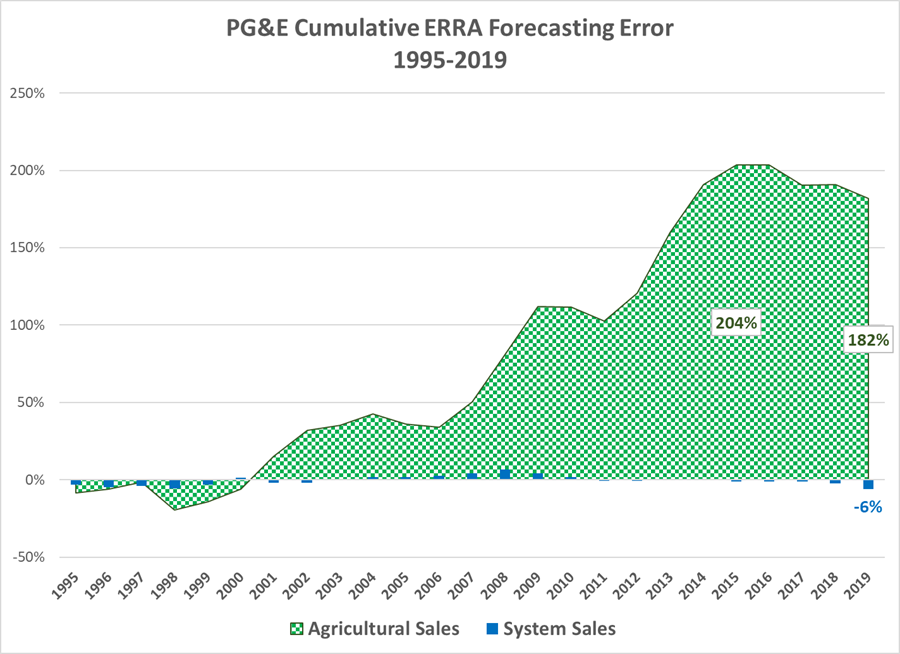
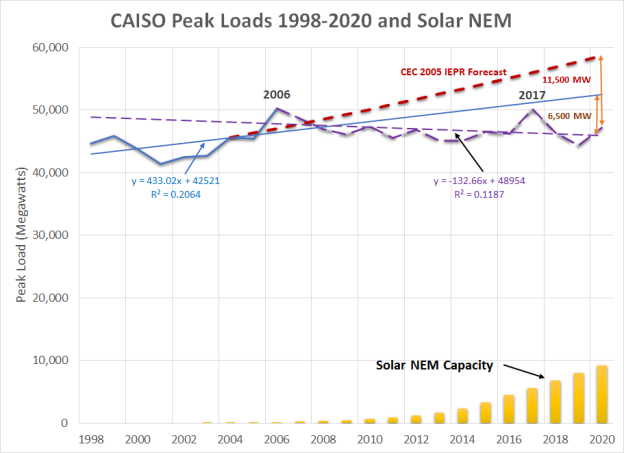
Solar net energy metered customers: Distributed solar generation installed under California’s net energy metering (NEM/NEMA) programs has mitigated and even eliminated load and demand growth in areas with established customers. This benefit supports protecting the investments that have been made by existing NEM/NEMA customers. Similarly, NEM/NEMA customers can displace investment in distribution assets. That distribution planners are not considering this impact appropriately is not an excuse for failing to value this benefit. For example, PG&E’s sales fell by 5% from 2010 to 2018 and other utilities had similar declines. Peak loads in the CAISO balancing authority reach their highest point in 2006 and the peak in August 2020 was 6% below that level.

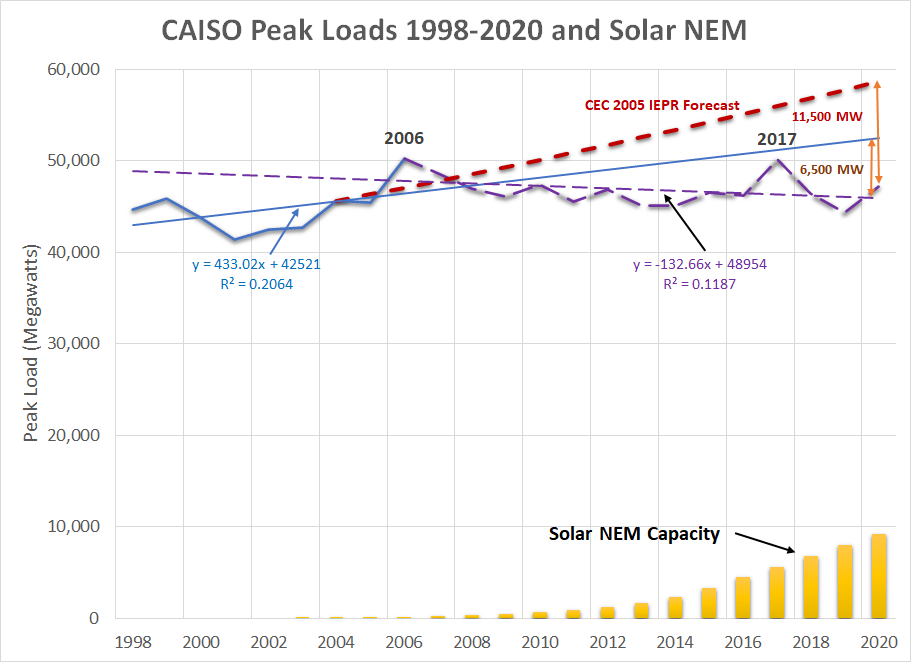
Much of that decrease appears to have been driven by the installation of rooftop solar. The figure above illustrates the trends in CAISO peak loads in the set of top lines and the relationship to added NEM/NEMA installations in the lower corner. It also shows the CEC’s forecast from its 2005 Integrated Energy Policy Report as the top line. Prior to 2006, the CAISO peak was growing at annual rate of 0.97%; after 2006, peak loads have declined at a 0.28% trend. Over the same period, solar NEM capacity grew by over 9,200 megawatts. The correlation factor or “R-squared” between the decline in peak load after 2006 and the incremental NEM additions is 0.93, with 1.0 being perfect correlation. Based on these calculations, NEM capacity has deferred 6,500 megawatts of capacity additions over this period. Comparing the “extreme” 2020 peak to the average conditions load forecast from 2005, the load reduction is over 11,500 megawatts. The obvious conclusion is that these investments by NEM customers have saved all ratepayers both reliability and energy costs while delivering zero-carbon energy.

The CPUC now has before it a rulemaking in which the utilities and some ratepayer advocates are proposing to not only radically reduce the compensation to new NEM/NEMA customers but also to change the terms of the agreements for existing ones.

One of the key principles of providing financial stability is setting prices and rates for long-lived assets such as solar panels and generation plants at the economic value when the investment decision was made to reflect the full value of the assets that would have been acquired otherwise.  If that new resource had not been built, either a ratebased generation asset would have been constructed by the utility at a cost that would have been recovered over a standard 30-year period or more likely, additional PPAs would have been signed. Additionally, the utilities’ investments and procurement costs are not subject to retroactive ratemaking under the rule prohibiting such ratemaking and Public Utilities Code Section 728, thus protecting shareholders from any risk of future changes in state or Commission policies.

Utility customers who similarly invest in generation should be afforded at least the same assurances as the utilities with respect to protection from future Commission decisions that may diminish the value of those investments. Moreover, customers do not have the additional assurances of achieving a certain net income so they already face higher risks than utility shareholders for their investments.

Generators are almost universally afforded the ability to recover capital investments based on prices set for multiple years, and often the economic life of their assets. Utilities are able to put investments in ratebase to be recovered at a fixed rate of return plus depreciation over several decades. Third-party generators are able to sign fixed price contracts for 10, 20, and even 40 years. Some merchant generators may choose to sell only into the short-term “hourly” market, but those plants are not committed to selling whenever the CAISO demands so. Generators are only required to do so when they sign a PPA with an assured payment toward investment recovery.

Ratepayers who make investments that benefit all ratepayers over the long term should be offered tariffs that provide a reasonable assurance of recovery of those investments, similar to the PPAs offered to generators. Ratepayers should be able to gain the same assurances as generators who sign long-term PPAs, or even utilities that ratebase their generation assets, that they will not be forced to bear all of the risk of investing of clean self-generation. These ratepayers should have some assurance over the 20-plus year expected life of their generation investment.

A new agricultural electricity use forecast method holds promise for water use management

Agricultural electricity demand is highly sensitive to water availability. Under “normal” conditions, the State Water Project (SWP) and Central Valley Project (CVP), as well as other surface water supplies, are key sources of irrigation water for many California farmers. Under dry conditions, these water sources can be sharply curtailed, even eliminated, at the same time irrigation requirements are heightened. Farmers then must rely more heavily on groundwater, which requires greater energy to pump than surface water, since groundwater must be lifted from deeper depths.

Over extended droughts, like between 2012 to 2016, groundwater levels decline, and must be pumped from ever deeper depths, requiring even more energy to meet crops’ water needs. As a result, even as land is fallowed in response to water scarcity, significantly more energy is required to water remaining crops and livestock. Much less pumping is necessary in years with ample surface water supply, as rivers rise, soils become saturated, and aquifers recharge, raising groundwater levels.

The surface-groundwater dynamic results in significant variations in year-to-year agricultural electricity sales. Yet, PG&E has assigned the agricultural customer class a revenue responsibility based on the assumption that “normal” water conditions will prevail every year, without accounting for how inevitable variations from these circumstances will affect rates and revenues for agricultural and other customers.

This assumption results in an imbalance in revenue collection from the agricultural class that does not correct itself even over long time periods, harming agricultural customers most in drought years, when they can least afford it. Analysis presented presented by M.Cubed on behalf of the Agricultural Energy Consumers Association (AECA) in the 2017 PG&E General Rate Case (GRC) demonstrated that overcollections can be expected to exceed $170 million over two years of typical drought conditions, with the expected overcollection $34 million in a two year period. This collection imbalance also increases rate instability for other customer classes.

Figure-1 compares the difference between forecasted loads for agriculture and system-wide used to set rates in the annual ERRA Forecast proceedings (and in GRC Phase 2 every three years) and the actual recorded sales for 1995 to 2019. Notably, the single largest forecasting error for system-wide load was a sales overestimate of 4.5% in 2000 and a shortfall in 2019 of 3.7%, while agricultural mis-forecasts range from an under-forecast of 39.2% in the midst of an extended drought in 2013 to an over-forecast of 18.2% in one of the wettest years on record in 1998. Load volatility in the agricultural sector is extreme in comparison to other customer classes.

Figure-2 shows the cumulative error caused by inadequate treatment of agricultural load volatility over the last 25 years. An unbiased forecasting approach would reflect a cumulative error of zero over time. The error in PG&E’s system-wide forecast has largely balanced out, even though the utility’s load pattern has shifted from significant growth over the first 10 years to stagnation and even decline. PG&E apparently has been able to adapt its forecasting methods for other classes relatively well over time.

The accumulated error for agricultural sales forecasting tells a different story. Over a quarter century the cumulative error reached 182%, nearly twice the annual sales for the Agricultural class. This cumulative error has consequences for the relative share of revenue collected from agricultural customers compared to other customers, with growers significantly overpaying during the period.

Agricultural load forecasting can be revised to better address how variations in water supply availability drive agricultural load. Most importantly, the final forecast should be constructed from a weighted average of forecasted loads under normal, wet and dry conditions. The forecast of agricultural accounts also must be revamped to include these elements. In addition, the load forecast should include the influence of rates and a publicly available data source on agricultural income such as that provided by the USDA’s Economic Research Service.

The Forecast Model Can Use An Additional Drought Indicator and Forecasted Agricultural Rates to Improve Its Forecast Accuracy

The more direct relationship to determine agricultural class energy needs is between the allocation of surface water via state and federal water projects and the need to pump groundwater when adequate surface water is not available from the SWP and federal CVP. The SWP and CVP are critical to California agriculture because little precipitation falls during the state’s Mediterranean-climate summer and snow-melt runoff must be stored and delivered via aqueducts and canals. Surface water availability, therefore, is the primary determinant of agricultural energy use, while precipitation and related factors, such as drought, are secondary causes in that they are only partially responsible for surface water availability. Other factors such as state and federal fishery protections substantially restrict water availability and project pumping operations greatly limiting surface water deliveries to San Joaquin Valley farms.

We found that the Palmer Drought Stress Index (PDSI) is highly correlated with contract allocations for deliveries through the SWP and CVP, reaching 0.78 for both of them, as shown in Figure AECA-3. (Note that the correlation between the current and lagged PDSI is only 0.34, which indicates that both variables can be included in the regression model.) Of even greater interest and relevance to PG&E’s forecasting approach, the correlation with the previous year’s PDSI and project water deliveries is almost as strong, 0.56 for the SWP and 0.53 for the CVP. This relationship can be seen also in Figure-3, as the PDSI line appears to lead changes in the project water deliveries. This strong relationship with this lagged indicator is not surprising, as both the California Department of Water Resources and U.S. Bureau of Reclamation account for remaining storage and streamflow that is a function of soil moisture and aquifers in the Sierras.

Further, comparing the inverse of water delivery allocations, (i.e., the undelivered contract shares), to the annual agricultural sales, we can see how agricultural load has risen since 1995 as the contract allocations delivered have fallen (i.e., the undelivered amount has risen) as shown in Figure-4. The decline in the contract allocations is only partially related to the amount of precipitation and runoff available. In 2017, which was among the wettest years on record, SWP Contractors only received 85% of their allocations, while the SWP provided 100% every year from 1996 to 1999. The CVP has reached a 100% allocation only once since 2006, while it regularly delivered above 90% prior to 2000. Changes in contract allocations dictated by regulatory actions are clearly a strong driver in the growth of agricultural pumping loads but an ongoing drought appears to be key here. The combination of the forecasted PDSI and the lagged PDSI of the just concluded water year can be used to capture this relationship.

Finally, a “normal” water year rarely occurs, occurring in only 20% of the last 40 years. Over time, the best representation of both surface water availability and the electrical load dependent on it is a weighted average across the probabilities of different water year conditions.

Proposed Revised Agricultural Forecast

We prepared a new agricultural load forecast for 2021 implementing the changes recommended herein. In addition, the forecasted average agricultural rate was added, which was revealed to be statistically valid. The account forecast was developed using most of the same variables as for the sales forecast to reflect similarities in drivers of both sales and accounts.

Figure-5 compares the performance of AECA’s proposed model to PG&E’s model filed in its 2021 General Rate Case. The backcasted values from the AECA model have a correlation coefficient of 0.973 with recorded values,[1] while PG&E’s sales forecast methodology only has a correlation of 0.742.[2] Unlike PG&E’s model almost all of the parameter estimates are statistically valid at the 99% confidence interval, with only summer and fall rainfall being insignificant.[3]

AECA’s accounts forecast model reflects similar performance, with a correlation of 0.976. The backcast and recorded data are compared in Figure-6. For water managers, this chart shows how new groundwater wells are driven by a combination of factors such as water conditions and electricity prices.


Davis, like many communities, needs a long-term vision

The Davis Vanguard published an article about the need to set out a vision for where the City of Davis wants to go if we want to have a coherent set of residential and commercial development decisions:

How do we continue to provide high quality of life for the residents of Davis, as the city on the one hand faces fiscal shortfalls and on the other hand continues to price the middle class and middle tier out of this community? A big problem that we have not addressed is the lack of any long term community vision. 

The article set out a series of questions that focused on assumptions and solutions. But we should not start the conversation with choosing a growth rate and then picking a set of projects that fit into that projection.

We need to start with asking a set of questions that derive from the thesis of the article:

  • – What is the composition that we want of this community? What type of diversity? How do we accommodate students? What are the ranges of statewide population growth that we need to plan for?
  • – To achieve that community composition, what is the range of target housing price? Given the projected UCD enrollment targets (which are basically out of our control), how much additional housing is needed under different scenarios of additional on campus housing?
  • – What is the jobs mix that supports that community composition under different scenarios? What’s the job mix that minimizes commuting and associated GHG emissions? 
  • – What’s the mix of businesses, jobs and housing that move toward fiscal stability for the City in these scenarios? 
  • – Then in the end we arrive at a set of preferred growth rates that are appropriate for the scenarios that we’ve constructed. We can then develop our general plan to accommodate these preferred scenarios. 

My wife and I put forward one vision for Davis to focus on sustainable food development as an economic engine. I’m sure there’s other viable ideas. We need a forum that dives into these and formulates our economic plan rather than just bumbling along as we seem to be doing now. This is only likely to get worse with the fundamental changes after the pandemic.

I’ll go further to say that one of the roots of this problem is the increasing opaqueness of City decision making. “Playing it safe” is the byword for City planning, just when that’s what is most likely to hurt us. That’s why we proposed a fix to the fundamental way decisions are made by the City.

There’s a long list of poor decisions created by this opaqueness that shows how this has cost the City tens of millions of dollars. He points out symptoms of a much deeper problem that is impeding us from developing a long term vision.

It may seem like so much “inside baseball” to focus on the nuts and bolts of process, but its that process that is at the root of the crisis, as boring as that may seem. 


Moving forward on Flood-MAR with pilots

The progress on implementing floodwater managed aquifer recharge programs (Flood-MAR) reminds me of the economist’s joke, “sure it works in practice, but does it work in theory?” A lot of focus seems to be on trying to refine the technical understanding of recharge, without going with what we already know about aquifer replenishment from decades of applications.

The Department of Water Resources Flood-MAR program recently held a public forum to discuss its research program. I presented a poster (shown above) on the findings of a series of studies we conducted for Sustainable Conservation on the economic and financial considerations for establishing these programs. (I posted about this last February.)

My conclusion from the presentations and the other publications we’ve followed is that the next step is to set up pilots using different institutional set ups and economic incentives. The scientists and engineers can further refine their findings, but we generally know where the soils are better for percolation versus others, and we know that crop productivity won’t fall too much where fields are flooded. The real issues fall into five categories, of which we’ve delved into four in our Floodwater Recharge Memos.

Benefits Diagrams_Page_5

The first is identifying the beneficiaries and the potential magnitude of those benefits. As can be seen in the flow chart above, there many more potential beneficiaries than just the local groundwater users. Some of these benefits require forecast informed reservoir operations (FIRO) to realize those gains through reduced flood control space, increased water supply storage and greater summertime hydropower output. Flood-MAR programs can provide the needed margin of error to lower the risk from FIRO.

FloodMAR Poster - Financing

The second is finding the funding mechanisms to compensate growers or to build dedicated recharge basins. We prepared a list of potential financing mechanisms linked to the potential beneficiaries. (This list grew out of another study that we prepared for the Delta Protection Commission on feasible options for beneficiary-pays financing.)

FloodMAR Poster Incentives

The third is determining what type of market incentive transactions mechanisms would work best at attracting the most preferred operations and acreage. I have explored the issues of establishing unusual new markets for a couple of decades, including for water rights transfer and air quality permit trading. It is not a simple case of “declaring markets exist” and then walking away. Managing institutions have important roles in setting up, running and funding any market, and most particularly for those that manage what were “public goods” that individuals and firms were able to use for free. The table above lists the most important considerations in establishing those markets.

The fourth assessing what type of infrastructure investment will produce the most cost-effective recharge. Construction costs (which we evaluated) is one aspect, and impacts on agricultural operations and financial feasibility are other considerations. The chart at the top summarizes the results from comparing several case studies. These will vary by situation, but remarkably, these options appear to cost substantially less than any surface storage projects currently being proposed.

The final institutional issue to be addressed, but not the least important, is determining the extent of rights over floodwaters and aquifers. California state law and regulations are just beginning to grapple with these issues. Certain areas are beginning to assert protection of their existing rights. This issue probably represents the single biggest impediment to these programs before attracting growers to participate.

All of these issues can be addressed in a range of pilot programs which use different variables to test which are likely to be more successful. Scientists and engineers can use these pilots to test for the impacts of different types of water diversion and application. Statistical regression analysis can provide us much of what we know without having to understand the hydrological dynamics. Legal rights can be assessed by providing temporary permits that might be modified as we learn more from the pilots.

Is it time to move forward with local pilot programs? Do we know enough that we can demonstrate the likely benefits? What other aspects should we explore before moving to widespread adoption and implementation?

Make “Sustainable Food” the Economic Engine of Downtown Davis


innovation-for-sustainable-food-and-agriculture-11-638

Many communities around the region, such as Sacramento and Woodland, have jumped on the “farm to fork” bandwagon to promote their relationships with agriculture. Davis can distinguish itself from the crowd by taking this a step further to promote itself as the center of “sustainable food.” In doing this, Davis can develop placemaking that is the key to economic development and vitality.

Davis is home to one of the top-rated food production research universities in the world in UC Davis. The City of Davis should leverage this position and strengthen its relationship to reinvigorate the downtown. The City has an opportunity as part of its Downtown Davis or Core Area Specific Plan to define a vision to achieve that goal.

Sustainable food minimizes damages to the planet in its cultivation, production, preparation, consumption and disposal. It is largely plant-based because this is the most direct way to deliver calories and protein to our diets. Animal production has much higher waste products, resource consumption, greenhouse gas emissions, and tainted food per calorie or gram of protein. For example, based on U.S. Department of Agriculture statistics, beef production emits four times as much greenhouse gases (GHGs) per calorie than soybeans or wheat and twice as much GHGs per gram of protein. Given California’s goal to be a “net carbon zero” emitter by 2045, the state will need to take a wide range of steps to cut emissions across the board, including in food production and consumption. Sustainable food is also more ethically consistent and healthful than our current food production and consumption patterns.

Sustainable food has been in the press frequently of late, with numerous stories in the Bay Area media. San Francisco has become the venture capital center of the world—especially for sustainable food–but real estate is becoming too expensive there to allow an industry that focuses on physical products sufficient space. Davis is close enough to that center for easy communication, but still has comparatively inexpensive land.

Creating a sustainable food ecology in Davis would have five aspects:

  1. Supporting innovation in sustainable food production and distribution
  2. Providing sustainable infrastructure to support companies that are innovating
  3. Serving and delivering sustainable food locally
  4. Preparing food that is consumed locally in a sustainable manner
  5. Attracting sustainable food-oriented tourism

The City can focus development of a sustainable food industry hub in the “Flex District” proposed for the G Street Corridor in the Downtown Plan. This area could house a wider range of facilities, such as test labs, within easy access distance of the UCD campus and the Capitol Corridor train to the Bay Area. Larger research facilities can be housed in other parts of the City where larger, industrial facilities are more appropriate.

Part of the attraction to companies locating here could be a sustainable infrastructure configuration starting in this district, with a district energy network and electric microgrid supporting fully electrified space conditioning and water heating systems. The other sustainability attributes identified in the Downtown Davis Plan should be incorporated and highlighted.

We can also encourage existing restaurants to serve more sustainable food on their menus, and attract new restaurants to cater to the new sustainable food businesses and their employees. The investors and workers at these companies are much more likely to follow their ethical beliefs in their consumption choices. The City could provide incentives through reduced fees to existing businesses, and evaluate how to speed the start up of new businesses.

As part of establishing a sustainable environment, the City should facilitate switching restaurants to more sustainable preparation practices. This includes switching from natural gas to induction cooktops and convection ovens, district water heating and space conditioning, and better management of waste. (Yes, we may need to recruit chefs for this new challenge.)

Finally, Davis can become a sustainable food destination. Less than 20% of our downtown visitors are from out of town according to analysis by consultants to City working on the Downtown Davis Plan. Given our location on the Capitol Corridor train route and Interstate 80, the community has much room for growth in tourism to boost our economy beyond UCD students’ parents visiting in September and June.

Davis already has a core attraction in its world-famous Farmers’ Market. With the addition of plant-based oriented restaurants and closer integration with the Mondavi Center entertainment area, a visitor could easily spend a whole day in Davis with a quick trip on the train from the Bay Area. Implementing this vision just needs closer coordination with UCD to bring events to Mondavi and the new Shrem Art Museum on Saturdays and setting up an electric bus shuttle between there and downtown.

UCD’s Robert Mondavi Institute for Wine and Food Sciences provides an example of how local development can be both sustainable and invigorating. That locale now has a microgrid that relies on renewable power. Both UCD and the City could benefit from a closer relationship centered around sustainable food in several dimensions.

Implementing all of this vision requires going beyond the form-based zoning codes that will come out of the Core Area Specific Plan. The City needs a comprehensive economic development plan, direction and resources for its economic development staff, and a willingness to focus on removing the barriers to bringing and supporting these businesses in Davis.

(with Anya McCann, COOL Cuisine)

Reblog: Inconvenient Truths about Landowner (Un)Willingness to Grow Dedicated Bioenergy Crops: Choices Magazine

Dedicated production of biofuels has been a Holy Grail for the sector, but this study finds that this is unlikely.

Source: 4th Quarter 2016 | Choices Magazine Online

Economic Analysis of the 2016 California Drought for Agriculture | California WaterBlog

by Josué Medellín-Azuara, Duncan MacEwan, Richard E. Howitt, Daniel A. Sumner, and Jay R. Lund The drought continues for California’s agriculture in 2016, but with much less severe and widespread i…

Source: Economic Analysis of the 2016 California Drought for Agriculture | California WaterBlog

Rethinking the rates that utilities offer to customers

I just got back from an annual conference put on by the Center for Research in Regulated Industries. It brings together many of the applied economists and policy analysts working in California’s electricity industry. I presented a paper on reconsidering rate design.

Customers are often left out of the conversation about how to move forward into the new energy future, as they were at the recent CAISO Symposium where not a single customer representative was included in the “Town Hall Meeting.” Current retail rate tariffs seem to be designed with little thought about how customers would prefer to pay for their energy, and what might best encourage consumer energy management. And when customers are asked to take on more risk or cost to address energy needs, their revenue responsibility is often unchanged.

How should utilities align their rates and tariffs to fit customers’ preferences? Utilities both face a rapidly evolving energy marketplace and have available to them a larger portfolio of technologies to provide more services and to measure usage across different dimensions. One important step that utilities could take is to offer customers the same variety of contracts as the utilities make with their suppliers, so that rates mirror the power market.

Customers have a range of preferences, and some prefer to be more innovative or risk takers than others. To better match the market, should utilities offer a range of tariffs, and even allow customers to construct a portfolio of rates that allow a mix of hedging strategies? How should the costs be allocated equitably to customers to reflect the varying risks in those portfolios? How should the benefits of lower costs be allocated between the active and passive customers? The new metering infrastructure also provides opportunities for different billing strategies.

How should time varying rate (TVR) periods be structured to adapt to the potential shift over time when peak meter loads occur? Should the periods be defined by utility-side resources or the combination with customer-side resources? Is the meter an arbitrary division for setting the price? What is the balance between rate stability to encourage customer investment versus matching changing system costs? Should the utilities offer different TVR periods depending on the desired incentives for customer response?
In developing costs, how should utilities and commissions consider how resources are added, and in what capacity? Renewables are now part of the incremental resources for “new” load, and we can no longer rely on the assumption that fossil fuels are the marginal resource 100% of the time.

The “super off-peak” rate offered by Southern California Edison (SCE) to agricultural customers is one example of how a rate can be constructed to encourage customer participation in autonomous ongoing energy management. Are the incentives appropriate for that rate? Over what term should these rates be set given customer investment?

If you’re interested in this paper, drop me a line and I’ll send it along.

The Elusive Potential of California’s Water Supply

NRDC and the Pacific Institute just released a report purporting to show the potential for large water savings in California in the face of our severe drought. While laying out the technical potential in a static setting is a useful exercise, this report can be misleading about the true potential for water savings without significant institutional and political change. The report doesn’t account for how farmers actually respond to improved irrigation efficiencies, and how residential customers resist changing their landscapes and using recycled water.

Starting with farmers, we found in a study on the benefits of aggregating PG&E’s agricultural accounts that growers were using subsurface drip systems increase tomato yields by as much as 50%. In Fresno County, processed tomato yields have risen 26% in 5 years as flood irrigation has been replaced by drip. In addition, the amount of runoff has been reduced, so on net the new efficient irrigation technologies have lead to increased productivity with no reduction in water use.

Residential customers are resistant to the idea that they should give up their lush landscaping. As I posted previously, even in environmentally-friendly Davis, voters rejected a new rate structure that would have encouraged summer water conservation. And they are just as thrilled with using recycled water. A 2004 SDCWA survey found that 63% of residents didn’t want recycled water introduced into their drinking water. All of this adds up to political resistance to change that water professionals see as a “no-brainer.”

Another question is what happens to the downstream and groundwater basin users who now depend on runoff for their water supplies? Particularly in agriculture, water is often reused several times as it drains or percolates to the next user. Calculating the true potential savings requires a full water-budget analysis of a basin, not just adding up all of the individual savings without considering the synergism among them.

And finally, what happens to the ability to respond to variations in water conditions? Urban water agencies are already concerned about “demand hardening.” Farmers have moved to higher yield, more profitable orchard crops, but as a result they can’t easily accommodate large swings in water availability. Managing our water supply isn’t just about reducing the average consumption–it’s about creating a less vulnerable system.