Tag Archives: energy economics

“Fixed costs” do not mean “fixed charges”

The California Public Utilities Commission has issued a proposed decision that calls for a monthly fixed charge of $24 for most customers. There is no basis in economic principles that calls for collecting “fixed costs” (too often misidentified) in a fixed charge. This so-called principle gets confused with the second-best solution for regulated monopoly pricing where the monopoly has declining marginal costs that are below average costs which has a two part tariff of a lump sum payment and variable prices at marginal costs. (And Ramsey pricing, which California uses a derivative of that in equal percent marginal cost (EPMC) allocation, also is a second-best efficient pricing method that relies solely on volumetric units.) The evidence for a natural monopoly is that average costs are falling over time as sales expand.

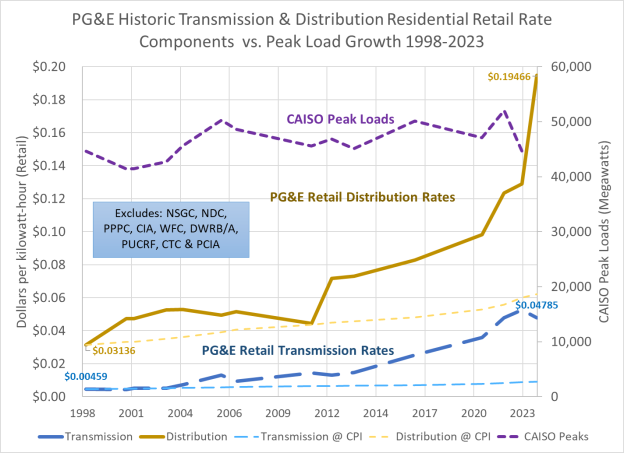
However, as shown by the chart above for PG&E’s distribution and transmission (and SCE’s looks similar), average costs as represented in retail rates are rising. This means that marginal costs must be above average costs. (If this isn’t true then a fully detailed explanation is required—none has been presented so far.) The conditions for regulated monopoly pricing with a lump sum or fixed charge component do not exist in California.

Using the logic that fixed costs should be collected through fixed charges, then the marketplace would be rife with all sorts of entry, access and connection fees at grocery stores, nail salons and other retail outlets as well as restaurants, car dealers, etc. to cover the costs of ownership and leases, operational overhead and other invariant costs. Simply put that’s not the case. All of those producers and providers price on a per unit basis because that’s how a competitive market works. In those markets, customers have the ability to choose and move among sellers, so the seller is forced to recover costs on a single unit price. You might respond, well, cell providers have monthly fixed charges. But that’s not true—those are monthly connection fees that represent the marginal cost of interconnecting to a network. And customers have the option of switching (and many do) to a provider with a lower monthly fee. The unit of consumption is interconnection, which is a longer period than the single momentary instance that economists love because they can use calculus to derive it.

Utility regulation is supposed to mimic the outcome of competitive markets, including pricing patterns. That means that fixed cost recovery through a fixed charge must be limited to a customer-dedicated facility which cannot be used by another customer. That would be the service connection, which has a monthly investment recovery cost of about $10 to $15/month. Everything else must be priced on a volumetric basis as would be in a competitive market. (And the rise of DERs is now introducing true competition into this marketplace.)

The problem is that we’re missing the other key aspect of competitive markets—that investors risk losing their investments due to poor management decisions. Virtually all of the excess stranded costs for California IOUs are due poor management, not “state mandates.” You can look at the differences between in-state IOU and muni rates to see the evidence. (And that an IOU has been convicted of killing nearly 100 people due to malfeasance further supports that conclusion.)

There are alternative solutions to California’s current dilemma but utility shareholders must accept their portion of the financial burden. Right now they are shielded completely as evidenced by record profits and rising share prices.

Opinion: What’s wrong with basing electricity fees on household incomes

I coauthored this article in the Los Angeles Daily News with Ahmad Faruqui and Andy Van Horn. We critique the proposed income-graduated fixed charge (IGFC) being considered at the California Public Utilities Commission.

Paradigm change: building out the grid with renewables requires a different perspective

Several observers have asserted that we will require baseload generation, probably nuclear, to decarbonize the power grid. Their claim is that renewable generation isn’t reliable enough and too distant from load centers to power an electrified economy.

Problem is that this perspective relies on a conventional approach to understanding and planning for future power needs. That conventional approach generally planned to meet the highest peak loads of the year with a small margin and then used the excess capacity to produce the energy needed in the remainder of the hours. This premise was based on using consumable fuel to store energy for use in hours when electricity was needed.

Renewables such as solar and wind present a different paradigm. Renewables capture and convert energy to electricity as it becomes available. The next step is to stored that energy using technologies such as batteries. That means that the system needs to be built to meet energy requirements, not peak loads.

Hydropower-dominated systems have already been built in this manner. The Pacific Northwest’s complex on the Columbia River and its branches for half a century had so much excess peak capacity that it could meet much of California’s summer demand. Meeting energy loads during drought years was the challenge. The Columbia River system could store up to 40% of the annual runoff in its reservoirs to assure sufficient supply.

For solar and wind, we will build enough capacity that is multiples of the annual peak load so that we can generate enough energy to meet those loads that occur when the sun isn’t shining and wind isn’t blowing. For example in a system relying on solar power, the typical demand load factor is 60%, i.e., the average load is 60% of the peak or maximum load. A typical solar photovoltaic capacity factor is 20%, i.e., it generates an average output that is 20% of the peak output. In this example system, the required solar capacity would be three times the peak demand on the system to produce sufficient stored electricity. The amount of storage capacity would equal the peak demand (plus a small reserve margin) less the amount of expected renewable generation during the peak hour.

As a result, comparing the total amount of generation capacity installed to the peak demand becomes irrelevant. Instead we first plan for total energy need and then size the storage output to meet the peak demand. (And that storage may be virtually free as it is embodied in our EVs.) This turns the conventional planning paradigm on its head.

The fundamental truth of marginal and average costs

Opponents of increased distributed energy resources who advocate for centralized power distribution insist that marginal costs are substantially below retail rates–as little as 6 cents per kilowatt-hour. Yet average costs generally continue to rise. For example, a claim has been repeatedly asserted that the marginal cost of transmission in California is less than a penny a kilowatt-hour. Yet PG&E’s retail transmission rate component went from 1.469 cents per kWh in 2013 to 4.787 cents in 2022. (SDG&E’s transmission rate is now 7.248 cents!) By definition, the marginal cost must be higher than 4.8 cents (and likely much higher) to increase that much.

Average costs equals the sum of marginal costs. Or inversely, marginal cost equals the incremental change in average costs when adding a unit of demand or supply. The two concepts are interlinked so that one must speak of one when speaking of the other.

The chart at the top of this post shows the relationship of marginal and average costs. Most importantly, it is not mathematically possible to have rising average costs when marginal costs are below average costs. So any assertion that transmission marginal costs are less than the average costs of transmission given that average costs are rising must be mathematically false.

Don’t get too excited about the fusion breakthrough yet

The U.S. Department of Energy announced on December 13 that a net positive fusion reaction achieved at the Lawrence Livermore National Laboratory. While impressive, this one last aside raises another substantial barrier:

“(T)he fusion reaction creates neutrons that significantly stress equipment, and could potentially destroy that equipment.”

While the momentary burst produced about 150% more energy than the input from the lasers, the lasers required about 150 times more energy than their output.

The technology won’t be ready for use until at least 2060, which is a decade after the goal of achieving net zero carbon emissions. That means that we need to plan and progress without relying on this energy source.

Do small modular reactors (SMR) hold real promise?

The economic analyses of the projected costs for small modular reactors (SMRs) appear to rely on two important assumptions: 1) that the plants will run at capacity factors of current nuclear plants (i.e., 70%-90%+) and 2) that enough will be built quickly enough to gain from “learning by doing” on scale as has occurred with solar, wind and battery technologies. The problem with these assumptions is that they require that SMRs crowd out other renewables with little impact on gas-fired generation.

To achieve low costs in nuclear power requires high capacity factors, that is the total electricity output relative to potential output. The Breakthrough Institute study, for example, assumes a capacity factor greater than 80% for SMRs. The problem is that the typical system load factor, that is the average load divided by the peak load, ranges from 50% to 60%. A generation capacity factor of 80% means that the plant is producing 20% more electricity than the system needs. It also means that other generation sources such as solar and wind will be pushed aside by this amount in the grid. Because the SMRs cannot ramp up and down to the same degree as load swings, not only daily but also seasonally, the system will still need load following fossil-fuel plants or storage. It is just the flip side of filling in for the intermittency of renewables.

To truly operate within the generation system in a manner that directly displaces fossil fuels, an SMR will have to operate at a 60% capacity factor or less. Accommodating renewables will lower that capacity factor further. Decreasing the capacity factor from 80% to 60% will increase the cost of an SMR by a third. This would increase the projected cost in the Breakthrough Institute report for 2050 from $41 per megawatt-hour to $55 per megawatt-hour. Renewables with storage are already beating this cost in 2022 and we don’t need to wait 30 years.

And the Breakthrough Institute study relies questionable assumptions about learning by doing in the industry. First, it assumes that conventional nuclear will experience a 5% learning benefit (i.e., costs will drop 5% for each doubling of capacity). In fact, the industry shows a negative learning rate--costs per kilowatt have been rising as more capacity is built. It is not clear how the SMR industry will reverse this trait. Second, the learning by doing effect in this industry is likely to be on a per plant rather than per megawatt or per turbine basis as has been the case with solar and turbines. The very small unit size for solar and turbine allows for off site factory production with highly repetitive assembly, whereas SMRs will require substantial on-site fabrication that will be site specific. SMR learning rates are more likely to follow those for building construction than other new energy technologies.

Finally, the report does not discuss the risk of catastrophic accidents. The probability of a significant accident is about 1 per 3,700 reactor operating years. Widespread deployment of SMRs will vastly increase the annual risk because that probability is independent of plant size. Building 1,000 SMRs could increase the risk to such a level that these accidents could be happening once every four years.

The Fukushima nuclear plant catastrophe is estimated to have cost $300 billion to $700 billion. The next one could cost in excess of $1 trillion. This risk adds a cost of $11 to $27 per megawatt-hours.

Adding these risk costs on top of the adjusted capacity factor, the cost ranges rises to $65 to $82 per megawatt-hour.

The real lessons from California’s 2000-01 electricity crisis and what they mean for today’s markets

The recent reliability crises for the electricity markets in California and Texas ask us to reconsider the supposed lessons from the most significant extended market crisis to date– the 2000-01 California electricity crisis. I wrote a paper two decades ago, The Perfect Mess, that described the circumstances leading up to the event. There have been two other common threads about supposed lessons, but I do not accept either as being true solutions and are instead really about risk sharing once this type of crisis ensues rather than being useful for preventing similar market misfunctions. Instead, the real lesson is that load serving entities (LSEs) must be able to sign long-term agreements that are unaffected and unfettered directly or indirectly by variations in daily and hourly markets so as to eliminate incentives to manipulate those markets.

The first and most popular explanation among many economists is that consumers did not see the swings in the wholesale generation prices in the California Power Exchange (PX) and California Independent System Operator (CAISO) markets. In this rationale, if consumers had seen the large increases in costs, as much as 10-fold over the pre-crisis average, they would have reduced their usage enough to limit the gains from manipulating prices. Consumers should have shouldered the risks in the markets in this view and their cumulative creditworthiness could have ridden out the extended event.

This view is not valid for several reasons. The first and most important is that the compensation to utilities for stranded assets investment was predicated on calculating the difference between a fixed retail rate and the utilities cost of service for transmission and distribution plus the wholesale cost of power in the PX and CAISO markets. Until May 2000, that difference was always positive and the utilities were well on the way to collecting their Competition Transition Charge (CTC) in full before the end of the transition period March 31, 2002. The deal was if the utilities were going to collect their stranded investments, then consumers rates would be protected for that period. The risk of stranded asset recovery was entirely the utilities’ and both the California Public Utilities Commission in its string of decisions and the State Legislature in Assembly Bill 1890 were very clear about this assignment.

The utilities had chosen to support this approach linking asset value to ongoing short term market valuation over an upfront separation payment proposed by Commissioner Jesse Knight. The upfront payment would have enabled linking power cost variations to retail rates at the outset, but the utilities would have to accept the risk of uncertain forecasts about true market values. Instead, the utilities wanted to transfer the valuation risk to ratepayers, and in return ratepayers capped their risk at the current retail rates as of 1996. Retail customers were to be protected from undue wholesale market risk and the utilities took on that responsibility. The utilities walked into this deal willingly and as fully informed as any party.

As the transition period progressed, the utilities transferred their collected CTC revenues to their respective holding companies to be disbursed to shareholders instead of prudently them as reserves until the end of the transition period. When the crisis erupted, the utilities quickly drained what cash they had left and had to go to the credit markets. In fact, if they had retained the CTC cash, they would not have had to go the credit markets until January 2001 based on the accounts that I was tracking at the time and PG&E would not have had a basis for declaring bankruptcy.

The CTC left the market wide open to manipulation and it is unlikely that any simple changes in the PX or CAISO markets could have prevented this. I conducted an analysis for the CPUC in May 2000 as part of its review of Pacific Gas & Electric’s proposed divestiture of its hydro system based on a method developed by Catherine Wolfram in 1997. The finding was that a firm owning as little as 1,500 MW (which included most merchant generators at the time) could profitably gain from price manipulation for at least 2,700 hours in a year. The only market-based solution was for LSEs including the utilities to sign longer-term power purchase agreements (PPAs) for a significant portion (but not 100%) of the generators’ portfolios. (Jim Sweeney briefly alludes to this solution before launching to his preferred linkage of retail rates and generation costs.)

Unfortunately, State Senator Steve Peace introduced a budget trailer bill in June 2000 (as Public Utilities Code Section 355.1, since repealed) that forced the utilities to sign PPAs only through the PX which the utilities viewed as too limited and no PPAs were consummated. The utilities remained fully exposed until the California Department of Water Resources took over procurement in January 2001.

The second problem was a combination of unavailable technology and billing systems. Customers did not yet have smart meters and paper bills could lag as much as two months after initial usage. There was no real way for customers to respond in near real time to high generation market prices (even assuming that they would have been paying attention to such an obscure market). And as we saw in the Texas during Storm Uri in 2021, the only available consumer response for too many was to freeze to death.

This proposed solution is really about shifting risk from utility shareholders to ratepayers, not a realistic market solution. But as discussed above, at the core of the restructuring deal was a sharing of risk between customers and shareholders–a deal that shareholders failed to keep when they transferred all of the cash out of their utility subsidiaries. If ratepayers are going to take on the entire risk (as keeps coming up) then either authorized return should be set at the corporate bond debt rate or the utilities should just be publicly owned.

The second explanation of why the market imploded was that the decentralization created a lack of coordination in providing enough resources. In this view, the CDWR rescue in 2001 righted the ship, but the exodus of the community choice aggregators (CCAs) again threatens system integrity again. The preferred solution for the CPUC is now to reconcentrate power procurement and management with the IOUs, thus killing the remnants of restructuring and markets.

The problem is that the current construct of the PCIA exit fee similarly leaves the market open to potential manipulation. And we’ve seen how virtually unfettered procurement between 2001 and the emergence of the CCAs resulted in substantial excess costs.

The real lessons from the California energy crisis are two fold:

  • Any stranded asset recovery must be done as a single or fixed payment based on the market value of the assets at the moment of market formation. Any other method leaves market participants open to price manipulation. This lesson should be applied in the case of the exit fees paid by CCAs and customers using distributed energy resources. It is the only way to fairly allocate risks between customers and shareholders.
  • LSEs must be able unencumbered in signing longer term PPAs, but they also should be limited ahead of time in the ability to recover stranded costs so that they have significant incentives to prudently procure resources. California’s utilities still lack this incentive.

Close Diablo Canyon? More distributed solar instead

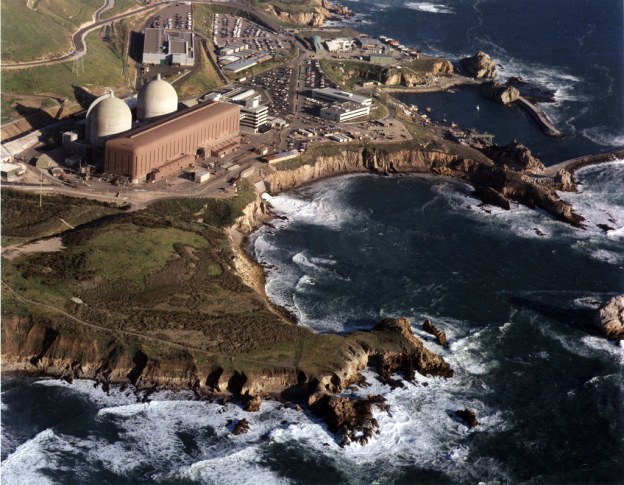
More calls for keeping Diablo Canyon have coming out in the last month, along with a proposal to match the project with a desalination project that would deliver water to somewhere. (And there has been pushback from opponents.) There are better solutions, as I have written about previously. Unfortunately, those who are now raising this issue missed the details and nuances of the debate in 2016 when the decision was made, and they are not well informed about Diablo’s situation.

One important fact is that it is not clear whether continued operation of Diablo is safe. Unit No. 1 has one of the most embrittled containment vessels in the U.S. that is at risk during a sudden shutdown event.

Another is that the decision would require overriding a State Water Resources Control Board decision that required ending the use of once-through cooling with ocean water. That cost was what led to the closure decision, which was 10 cents per kilowatt-hour at current operational levels and in excess of 12 cents in more likely operations.

So what could the state do fairly quickly for 12 cents per kWh instead? Install distributed energy resources focused on commercial and community-scale solar. These projects cost between 6 and 9 cents per kWh and avoid transmission costs of about 4 cents per kWh. They also can be paired with electric vehicles to store electricity and fuel the replacement of gasoline cars. Microgrids can mitigate wildfire risk more cost effectively than undergrounding, so we can save another $40 billion there too. Most importantly they can be built in a matter of months, much more quickly than grid-scale projects.

As for the proposal to build a desalination plant, pairing one with Diablo would both be overkill and a logistical puzzle. The Carlsbad plant produces 56,000 acre-feet annually for San Diego County Water Agency. The Central Coast where Diablo is located has a State Water Project allocation of 45,000 acre-feet which is not even used fully now. That plant uses 35 MW or 1.6% of Diablo’s output. A plant built to use all of Diablo’s output could produce 3.5 million acre-feet, but the State Water Project would need to be significantly modified to move the water either back to the Central Valley or beyond Santa Barbara to Ventura. All of that adds up to a large cost on top of what is already a costly source of water of $2,500 to $2,800 per acre-foot.

Getting EVs where we need them in multi family and low-income communities

They seem to be everywhere. A pickup rolls up to a dark house in a storm during the Olympics and the house lights come on. (And even powers a product launch event when the power goes out!) The Governator throws lightning bolts like Zeus in a Super Bowl ad touting them. The top manufacturer is among the most valuable companies in the world and the CEO is a cultural icon. Electric vehicles (EVs) or cars are making a splash in the state.

The Ford F-150 Lightning pick up generated so much excitement last summer that it had to increase its initial roll out from 40,000 to 80,000 to 200,000 due to demand. General Motors answered with electric versions of the Silverado and Hummer. (Dodge is bringing up the rear with its Ram and Dakota pickups.)

Much of this has been spurred by California’s EV sales mandates that date back to 1990. The state now plans to phase out the sale of new cars and passenger trucks entirely by 2035, with 35% of sales by 2026. In the first quarter of 2022, EVs were 16% of new car sales.

While EVs look they will be here to stay, the question is where will drivers be able to charge up? That means recharging at home, at work, and on the road when needed. The majority of charging—70% to 80%–occurs at home or at work. Thanks to the abundance of California’s renewable energy, largely from solar power including from rooftops, the most advantageous time is in the middle of the day. The next big hurdle will be putting charging stations where they are needed, most valuable and accessible to those who don’t live in conventional single-family housing.

The state has about 80,000 public and shared private chargers, of which about 10% are DC “fast chargers” that can deliver 80% capacity in about 30 minutes. Yet we likely need 20 times more chargers that what we have today.

Multi-family housing is considered a prime target for additional chargers because of various constraints on tenants such as limitations on installing and owning a charging station and sharing of parking spaces. Community solar panels can be outfitted with charging stations that rely on the output of the panels.

California has a range of programs to provide incentives and subsidies for installing chargers. Funding for another 5,000 chargers was recently authorized. The state funds the California Electric Vehicle Infrastructure Project (CALeVIP) that provides direct incentives and works with local partners plan and install Level 2 and DC fast charging infrastructure. This program has about $200 million available. The program has 13 county and regional projects that contribute $6,000 and more for Level 2 chargers and often $80,000 for a DC fast charger. A minimum of 25% of funds are reserved for disadvantaged and low-income communities. In many cases, the programs are significantly oversubscribed with waiting lists, but the state plans to add enough funding for an additional 100,000 charging stations in the 2022-23 fiscal year, with $900 million over the next four years.

California’s electric utilities also fund charging projects, although those programs open and are quickly oversubscribed.

  • Southern California Edison manages the Charge Ready program with a focus on multi-family properties including mobilehome parks. The program offers both turn-key installation and rebates. SCE’s website provides tools for configuring a parking lot for charging.
  • San Diego Gas & Electric offered Power Your Drive to multi-family developments, with 255 locations currently. SDG&E has added the Power Your Drive Extension to add another 2,000 charging stations over the next two years. SDG&E will provide up to $12,000 for Level 2 chargers and additional maintenance funding.
  • Pacific Gas & Electric offered the EV Charge program in which PG&E will pay for, own, maintain and coordinate construction of infrastructure from the transformer to the parking space, as well as support independent ownership and operation. The program is not currently taking applications however. PG&E’s website offers other tools for assessing the costs and identifying vendors for installing chargers.
  • PG&E is launching a “bidirectional” EV charging pilot program with General Motors that will test whether EVs can be used to improve electric system reliability and resilience by using EVs as back up energy storage. The goal is to extend the program by the end of 2022. This new approach may provide EV owners with additional value beyond simply driving around town. PG&E also is setting up a similar pilot with Ford.
  • Most municipally-owned electric utilities offer rebates and incentives as well..

Community residents have a range of incentives available to them to purchase an EV.

  • The state offers $750 through the Clean Fuel Reward on the purchase of a new EV. .
  • California also offers the Clean Vehicle Rebate Project that offers $1,000 to $7,000 for buying or leasing a (non-Tesla) to households making less than $200,000 or individuals making less than $135,000. Savings depend on location and vehicle acquired.
  • Low-income households can apply for a state grant to purchase a new or used electric or hybrid vehicle, plus $2,000 for a home charging station, through the Clean Vehicle Assistance Program. The income standards are about 50% higher than those establishing eligibility for the CARE utility rate discount. The average grant is about $5,000.
  • The federal government offers a tax credit of up to $7,500 depending on the make and model of vehicle.
  • Car owners also can scrap their gasoline-fueled cars for $1,000 to $1,500, depending on household income.
  • Several counties, including San Diego and Sonoma, have offered EV purchase incentives to county residents. Those programs open and fill fairly quickly.

The difference between these EVs coming down the road (yes, that’s a pun) and the current models is akin to the difference between flip phones and smart phones. One is a single function communication device, and we use the latter to manage our lives. The marketing of EVs could shift course to emphasize these added benefits that are not possible with a conventional vehicle. We can expect a similar transformation in how we view energy and transportation as the communication and information revolution.

What “Electrify Everything” has wrong about “reduce, reuse, recycle”

Saul Griffith has written a book that highlights the role of electrification in achieving greenhouse gas emission reductions, and I agree with his basic premise. But he misses important aspects about two points. First, the need to reduce, reuse and recycle goes well beyond just energy consumption. And second, we have the ability to meet most if not all of our energy needs with the lowest impact renewable sources.

Reduce, reuse and recycle is not just about energy–it’s also about reducing consumption of natural resources such as minerals and biomass, as well as petroleum and methane used for plastics, and pollution caused by that consumption. In many situations, energy savings are only a byproduct. Even so, almost always the cheapest way to meet an energy need is to first reduce its use. That’s what energy efficiency is about. So we don’t want to just tell consumers to continue along their merry way, just switch it up with electricity. A quarter to a third our global GHG emissions are from resource consumption, not energy use.

In meeting our energy needs, we can largely rely on solar and wind supplemented with biofuels. Griffith asserts that the U.S. would need 2% of its land mass to supply the needed electricity, but his accounting makes three important errors. First, placing renewables doesn’t eliminate other uses of that land, particularly for wind. Acreage devoted to wind in particular can be used also for different types of farming and even open space. In comparison, fossil-fuel and nuclear plants completely displace any other land use. Turbine technology is evolving to limit avian mortality (and even then its tall buildings and household cats that cause most bird deaths). Second most of the solar supply can be met on rooftops and covering parking lots. These locations are cost effective compared to grid scale sources once we account for transmission costs. And third, our energy storage is literally driving down the road–in our new electric vehicles. A 100% EV fleet in California will have enough storage to meet 30 times the current peak load. A car owner will be able to devote less than 5% of their battery capacity to meet their home energy needs. All of this means that the real footprint can be much less than 1%.

Nuclear power has never lived up to its promise and is expensive compared to other low-emission options. While the direct costs of current-technology nuclear power is more than 12 cents a kilowatt-hour when adding transmission, grid-scale renewables are less than half of that, and distributed energy resources are at least comparable with almost no land-use footprint and able to provide better reliability and resilience. In addition, the potential of catastrophic events at nuclear plants adds another 1 to 3 cents per kilowatt-hour. Small modular reactors (SMR) have been promoted as a game changer, but we have been waiting for two decades. Nuclear or green hydrogen may emerge as economically-viable options, but we shouldn’t base our plans on that.