
Technologies and policies that enhance the development of decentralized energy resources have generated increasing interest over the last couple of years. I’ll write more in the future about what are the underlying drivers, both technological and institutional.
I’ve been interested in the question of where do we stand, and how long might it take for diffusion of these new technologies. We can look back and see how technology transformed lives in just a couple of decades. Compare kitchens from 1900 and 1930; if we walked into the earlier kitchen, most of us would be lost, but we could whip up a meal in 1930.


Or the rapid adoption of autos. In 1909, people could stand in the middle of Pike Street in Seattle and talk:

Not so safely in 1930:

Do we stand today at a point just at the onset of a new technological evolution?
One question to be answered is whether our institutional settings will allow these new technologies. In one case, it appears that Germany has already chosen its road. But in the US, whether we rely on central power stations using transmission lines may still be a question in play. That deserves a separate post of its own.
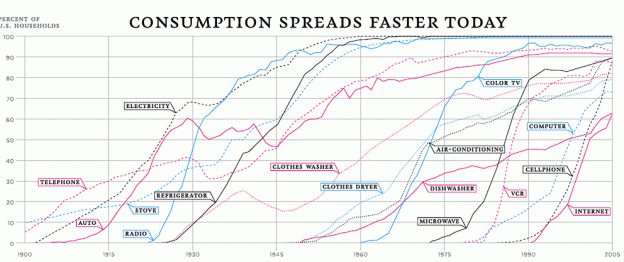
If we assume that we choose the decentralized path, what might we expect in when these technologies are adopted widely. A couple of graphics illustrate historic diffusion rates. This is one from VisualEconomics via The Atlantic:

Another one from Forbes via The Technium shows the parallel development paths (however, I don’t like starting at the year of invention instead of a threshold adoption level):

One might interpret the upper graph as showing accelerating adoption rates. But I interpret the lower chart as illustrating at least two factors that drive diffusion: the relative importance of network infrastructure and the expense relative to individual wealth. Autos, telephones and electricity all required construction of a large network of roads or wires, often funded with public investment. Individuals can’t choose to adopt the technology until a larger public decision is made to facilitate that adoption. As to expense, refrigerators and dishwashers were large household investments for many years, and cars are still a large single expenditure. On the other hand, cell phones, radios and televisions quickly became inexpensive which lubricated diffusion. We need another graphic showing how diffusion rates relate to these two different axes.
We are still unsure where decentralized energy technologies will fall among these characteristics. They may seem small and inexpensive, but enough solar panels to power a house will still be several thousand dollars for the foreseeable future. And the how much electric network investment is required to integrate these resources is the center of the debate over technology policies.
Too often studies making forecasts and policy recommendations don’t consider what adoption rates are feasible or probable. However a study comes along and incorporates this concept as its centerpiece. A good example is the Clean Energy Vision Project’s Western Grid 2050 report. Lead by a former colleague Carl Linvill, who’s now at the Regulatory Assistance Project, it looked at several different scenarios for technology diffusion. Such studies give us a better understanding of what’s actually possible rather than what we wish for.

This is part of a body of research pointing to the same things in different areas. Scientific and industrial progress is heterogeneous, incremental, and relentless. It’s more like hordes of searchers noticing the same things simultaneously than lone geniuses in solitary labs.
https://www.sciencedirect.com/science/article/pii/S0048733321000950#
Technological improvement rate predictions for all technologies: Use of patent data and an extended domain description
In this work, we provide predicted yearly performance improvement rates for nearly all definable technologies for the first time. We do this by creating a correspondence of all patents within the US patent system to a set of 1757 technology domains. A technology domain is a body of patented inventions achieving the same technological function using the same knowledge and scientific principles. These domains contain 97.2% of all patents within the entire US patent system. From the identified patent sets, we calculated the average centrality of the patents in each domain to predict their improvement rates, following a patent network-based methodology tested in prior work. They vary from a low of 2% per year for the Mechanical Skin treatment- Hair Removal and wrinkles domain to a high of 216% per year for the Dynamic information exchange and support systems integrating multiple channels domain, but more that 80% of technologies improve at less than 25% per year. Fast improving domains are concentrated in a few technological areas. The domains that show improvement rates greater than the predicted rate for integrated chips, from Moore’s law, are predominantly based upon software and algorithms. In addition, the rates of improvement were not a strong function of the patent set size.
Highlights
• A comprehensive granular account of the rate of technological change.
• Predicted improvement rates for 1757 domains containing 97.2% of US patent system.
• Improvement rates are not uniformly distributed across and within categories.
• Fastest improving domains are predominantly software-related.
• Online system for searching domains and improvement rates based on keywords.
LikeLike
Pingback: Electric vehicles as the next smartphone | Economics Outside the Cube
Pingback: Misunderstanding the Green New Deal | Economics Outside the Cube
Pingback: Community choice spreading across California | Economics Outside the Cube
An article on how EVs might reach cost parity in 2022 and rapidly accelerate market penetration: http://www.vox.com/2016/3/4/11161758/electric-cars-oil-crisis
LikeLike