

A key driver in rising California electricity rates has been distribution costs as shown in the chart above. The distribution rate component has been increasing in lock step with utilities’ revenue requirements since at least 2002. Purported load departure has had no measurable impact on rates as the value of energy efficiency and distributed energy resources have closely mirrored the displaced utility spending over that period.
The most likely source of the increase in distribution costs is overforecasting load growth in the utilities’ General Rate Cases (GRC) after 2006. As described in this California Solar & Storage Association (CalSSA) whitepaper, customer investment in rooftop solar displaced load growth and CAISO peak demands have remained flat, but utility forecasts failed to account for this.
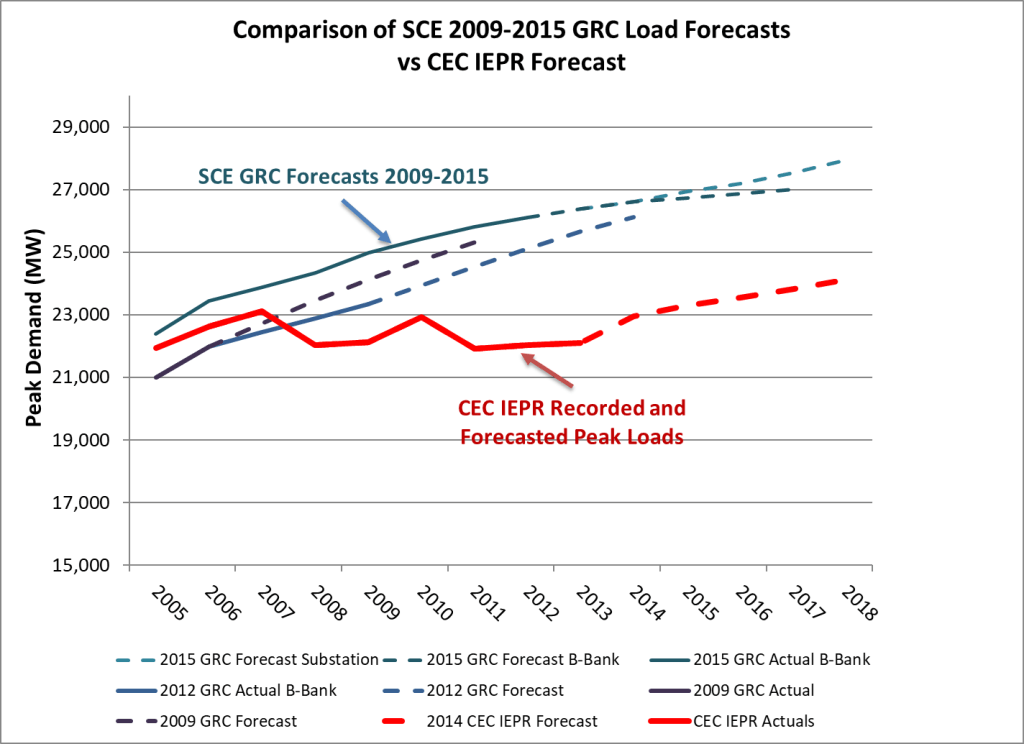
While testifying on behalf of the Agricultural Energy Consumers Association (AECA) in PG&E and SCE GRC Phase IIs from 2009 to 2018 we presented data comparing the accuracy of the utilities forecasts to those from the California Energy Commission’s Integrated Energy Policy Report (IEPR). The IEPR forecasts were consistently much more accurate (and still biased high.) (We moved on to different issues after 2018.)
The first chart shows how PG&E consistently misforecasted. SCE shows the same biased errors in the second chart. An important source of this error appears to be the utilities failing to reconcile the sum of local planning area and division forecasts with the overall system forecast. We asked for data showing this reconciliation but never received evidence of this critical task. Starting in 2018, however, the utilities started using local area forecasts created by the CEC which mitigates this source of error.

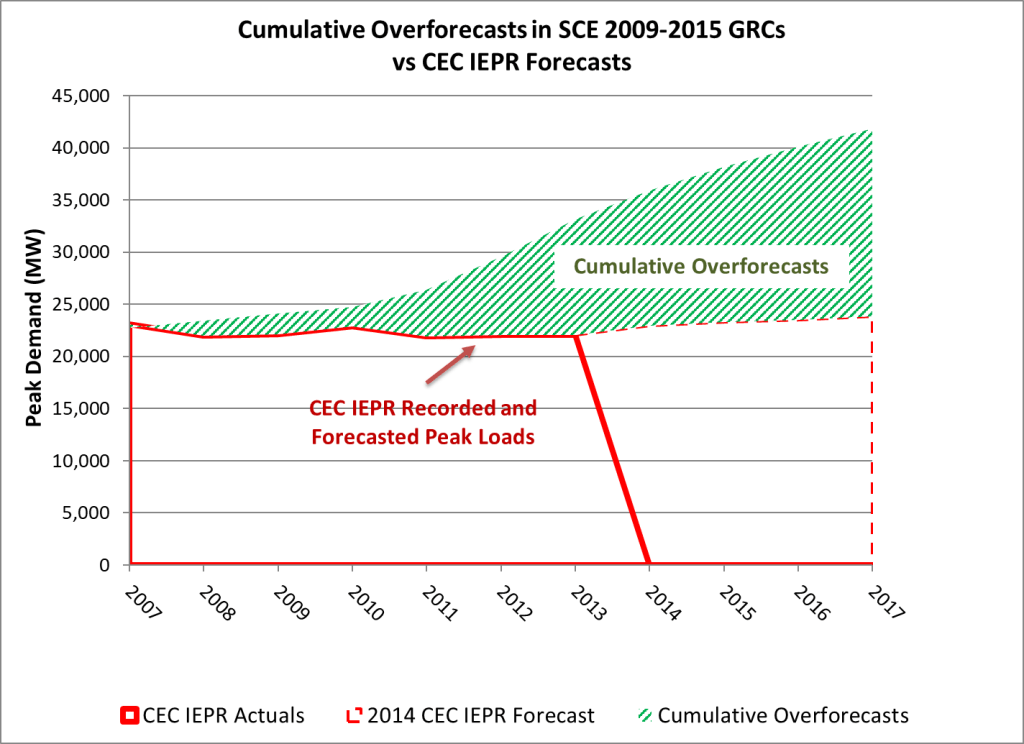
Nevertheless, the utilities requested, and the CPUC authorized, large investments that increased the distribution rate base which then rolls into the revenue requirements and rates. The assets installed in excess of demand simply accumulated in the investment ratebase and the additional excess from the next GRC was layered on top. The two charts below show for PG&E and SCE the cumulative amount of overforecast over three GRCs. These imply that each utility was authorized to build substantially more infrastructure than what was actually needed. For PG&E this amounted to 99% by 2019 and for SCE, 76% more by 2017.

These investments facilitated by the forecast errors kept accreting but the CPUC never went back to audit whether theses assets were actually used and useful. If not used and useful, the CPUC could act to disallow recovery of these costs until load growth is sufficient to create a need for these lines and transformers.
In PG&E’s 1996 GRC, AECA showed that the utility was planning to add substantial distribution infrastructure in the farmlands around Fresno for suburban growth that was unlikely to materialize. The CPUC agreed with us and refused to authorize that investment. It took substantial effort by this intervenor to prepare that analysis, but it demonstrated the effectiveness of such oversight that has not been duplicated by the CPUC elsewhere.
This lack of oversight and action is one reason why the policy of decoupling, which separates cost recovery from sales, has failed to control costs in California. Decoupling may have reduced utilities’ opposition to energy efficiency (although now they are coming after rooftop solar which has an identical effect as energy efficiency), but the utilities quickly discovered that the CPUC did not have either the capabilities or the appetite to penalize overinvestment. This is the root cause of California’s high rates.

It’s not just the electric utilities that have badly missed their demand forecasts. The state’s water utilities have been off by 74% on 20 year projections:
https://agupubs.onlinelibrary.wiley.com/doi/10.1029/2025WR040474
This study investigates the accuracy of long-term water demand projections and tracks the evolution of water demand management incentives across 61 California water suppliers from 2000 to 2020. Through a systematic analysis of Urban Water Management Plans, we find that water suppliers consistently overestimated future demand by an average of 25% for 5-year projections and 74% for 20-year projections. This overestimation stems primarily from assumptions about per capita water demand rather than population growth estimates. While suppliers generally projected stable or increasing per capita demand, actual water demand per capita declined by 1.9% annually between 2000 and 2020, leading to a decoupling of water demand from population growth. Concurrently, we document a substantial increase in water demand management incentives, with non-voluntary regulations emerging as the dominant demand management approach by 2020, largely driven by state policies like the Model Water Efficient Landscape Ordinance and California Green Building Standards. Demand management efforts have evolved from primarily indoor and educational initiatives toward outdoor-focused non-voluntary regulations and rebates. This shift appears closely linked to the reduction in per capita demand that suppliers failed to fully capture in their water demand projections. Our findings underscore the importance of incorporating dynamic conservation trends into demand projections and suggest that suppliers should develop more sophisticated forecasting methods that account for the continuing evolution of water efficiency incentives. This research provides valuable insights for water resource planners seeking to improve the accuracy of water demand projections in an era of increasing conservation and climate uncertainty.
Key Points
LikeLike
Pingback: Discerning what drives rate increases is more complex than shown in LBNL study | Economics Outside the Cube
In negotiating a deal with San Jose to provide power for new developments, PG&E recently admitted that “California’s electrical grid is currently underutilized by approximately 40%, indicating excess capacity for other uses,” supporting this finding that utilities overinvested in grid resources.[1]
[1] Devan Patel, “San Jose strikes deal with PG&E, committing utility provider to delivering major grid improvements,” San Jose Mercury-News, https://www.mercurynews.com/2025/07/25/san-jose-strikes-deal-pge-data-center-energy-investment/, July 25, 2025.
LikeLike
Pingback: A key policy tool intended to promote energy efficiency is instead being used against saving energy | Economics Outside the Cube