Recently the questions about whether electric vehicles increase greenhouse gas (GHG) emissions and tracking emissions directly to generation on a 24/7 basis have gained saliency. This focus on immediate grid-created emissions illustrates an important concept that is overlooked when looking at marginal emissions from electricity. The decision to consume electricity is more often created by a single large purchase or action, such as buying a refrigerator or a new electric vehicle, than by small decisions such as opening the refrigerator door or driving to the grocery store. Yet, the conventional analysis of marginal electricity costs and emissions assumes that we can arrive at a full accounting of those costs and emissions by summing up the momentary changes in electricity generation measured at the bulk power markets created by opening that door or driving to the store.
But that’s obviously misleading. The real consumption decision that created the marginal costs and emissions is when that item is purchased and connected to the grid. And on the other side, the comparative marginal decision is the addition of a new resource such as a power plant or an energy efficiency investment to serve that new increment of load.
So in that way, your flight to Boston is not whether you actually get on the plane, which is like opening the refrigerator door, but rather your purchase of the ticket which led to the incremental decision by the airline to add another scheduled flight. It’s the share of the fuel use for that added flight which is marginal, just as buying a refrigerator is responsible for the share of the energy from the generator added to serve the incremental long-term load.
There are growing questions about the use of short run market prices as indicators of market value of generation assets for a number of reasons. This paper critiquing “surge” pricing on the grid has one set of aspects that undermine that principle.
Meredith Fowley at the Energy Institute at Haas compared two approaches to measuring the additional GHG emissions from a new electric vehicle. The NREL paper uses the correct approach of looking at longer term incremental resource additions rather than short run operating emissions. The hourly marginal energy use modeled by Holland et al (2022) is not particularly relevant to the question of GHG emissions from added load for several reasons and for that reason any study that doesn’t use a capacity expansion model will deliver erroneous results. In fact, you will get more accurate results from relying on a simple spreadsheet model using capacity expansion than a complex production cost hourly model.
In the electricity grid, added load generally doesn’t just require increased generation from existing plants, but rather it induces investment in new generation (or energy savings elsewhere, which have zero emissions) to meet capacity demands. This is where economists make a mistake thinking that the “marginal” unit is additional generation from existing plants–in a capacity limited system such as the electricity grid, its investment in new capacity.
That average emissions are falling as shown in Holland et al while hourly “marginal” emissions are rising illustrates this error in construction. Mathematically that cannot be happening if the marginal emission metric is correct. The problem is that Holland et al have misinterpreted the value they have calculated. It is in fact not the first derivative of the average emission function, but rather the second partial derivative. That measures the change in marginal emissions, not marginal emissions themselves. (And this is why long-run marginal costs are the relevant costing and pricing metric for electricity, not hourly prices.) Given that 75% of new generation assets in the U.S. were renewables, it’s difficult to see how “marginal” emissions are rising when the majority of new generation is GHG-free.
The second issue is that the “marginal” generation cannot be identified in ceteris paribus (i.e., all else held constant) isolation from all other policy choices. California has a high RPS and 100% clean generation target in the context of beneficial electrification of buildings and transportation. Without the latter, the former wouldn’t be pushed to those levels. The same thing is happening at the federal level. This means that the marginal emissions from building decarbonization and EVs are even lower than for more conventional emission changes.
Further, those consumers who choose beneficial electrification are much more likely to install distributed energy resources that are 100% emission free. Several studies show that 40% of EV owners install rooftop solar as well, far in excess of the state average, (In Australia its 60% of EV owners.) and they most likely install sufficient capacity to meet the full charging load of their EVs. So the system marginal emissions apply only to 60% of EV owners.
There may be a transition from hourly (or operational) to capacity expansion (or building) marginal or incremental emissions, but the transition should be fairly short so long as the system is operating near its reserve margin. (What to do about overbuilt systems is a different conversation.)
There’s deeper problem with the Holland et al papers. The chart that Fowlie pulls from the article showing that marginal emissions are rising above average emissions while average emissions are falling is not mathematically possible. (See for example, https://www.thoughtco.com/relationship-between-average-and-marginal-cost-1147863) For average emissions to be falling, marginal emissions must be falling and below average emissions. The hourly emissions are not “marginal” but more likely are the first derivative of the marginal emissions (i.e., the marginal emissions are falling at a decreasing rate.) If this relationship holds true for emissions, that also means that the same relationship holds for hourly market prices based on power plant hourly costs.
All of that said, it is important to incentivize charging during high renewable hours, but so long as we are adding renewables in a manner that quantitatively matches the added EV load, regardless of timing, we will still see falling average GHG emissions.
It is mathematically impossible for average emissions to fall while marginal emissions are rising if the marginal emission values are ABOVE the average emissions, as is the case in the Holland et al study. What analysts have heuristically called “marginal” emissions, i.e., hourly incremental fuel changes, are in fact, not “marginal”, but rather the first derivative of the marginal emissions. And as you point out the marginal change includes the addition of renewables as well as the change in conventional generation output. Marginal must include the entire mix of incremental resources. How marginal is measured, whether via change in output or over time doesn’t matter. The bottom line is that the term “marginal” must be used in a rigorous economic context, not in a casual manner as has become common.
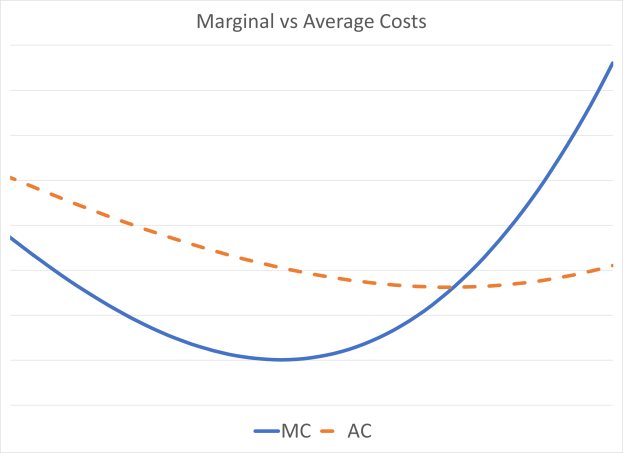
Often the marginal costs do not fit the theoretical mathematical construct based on the first derivative in a calculus equation that economists point to. In many cases it is a very large discreet increment, and each consumer must be assigned a share of that large increment in a marginal cost analysis. The single most important fact is that for average costs to be rising, marginal costs must be above average costs. Right now in California, average costs for electricity are rising (rapidly) so marginal costs must be above those average costs. The only possible way of getting to those marginal costs is by going beyond just the hourly CAISO price to the incremental capital additions that consumption choices induce. It’s a crazy idea to claim that the first 99 consumers have a tiny marginal cost and then the 100th is assigned the responsibility for an entire new addition such as another flight scheduled or a new distribution upgrade.
We can consider the analogy to unit commitment, and even further to the continuous operation of nuclear power plants. The airline scheduled that flight in part based on the purchase of the plane ticket, not on the final decision just before the gate was closed. Not flying saved a miniscule amount of fuel, but the initial scheduling decision created the bulk of the fuel use for the flight. In a similar manner a power plant that is committed several days before an expected peak load burns fuels while idling in anticipation of that load. If that load doesn’t arrive, that plant avoids a small amount of fuel use, but focusing only on the hourly price or marginal fuel use ignores the fuel burned at a significant cost up to that point. Similarly, Diablo Canyon is run at a constant load year-round, yet there are significant periods–weeks and even months–where Diablo Canyon’s full operational costs are above the CAISO market clearing price average. The nuclear plant is run at full load constantly because it’s dispatch decision was made at the moment of interconnection, not each hour, or even each week or month, which would make economic sense. Renewables have a similar characteristic where they are “scheduled and dispatched” effectively at the time of interconnection. That’s when the marginal cost is incurred, not as “zero-cost” resources each hour.
Focusing solely on the small increment of fuel used as a true measure of “marginal” reflects a larger problem that is distorting economic analysis. No one looks at the marginal cost of petroleum production as the energy cost of pumping one more barrel from an existing well. It’s viewed as the cost of sinking another well in a high cost region, e.g., Kern County or the North Sea. The same needs to be true of air travel and of electricity generation. Adding one more unit isn’t just another inframarginal energy cost–it’s an implied aggregation of many incremental decisions that lead to addition of another unit of capacity. Too often economics is caught up in belief that its like classical physics and the rules of calculus prevail.