I wrote this guest column in the Davis Enterprise about the City’s Climate Action and Adaptation Plan. (Thank you John Mott-Smith for extending the privilege.)
Dear Readers, the guest column below was written by Richard McCann, a Davis resident and expert on energy and climate action plans.
————
The city of Davis is considering its first update of its Climate Action and Adaptation Plan since 2010 with a 2020-2040 Plan. The city plans to update the CAAP every couple of years to reflect changing conditions, technologies, financing options, laws and regulations.
The plan does not and cannot achieve a total reduction in greenhouse gas emissions simply because we do not control all of the emission sources — almost three-quarters of our emissions are from vehicles that are largely regulated by state and federal laws. But it does lay out a means to putting a serious dent in the overall amount.
The CAAP offers a promising future and accepts that we have to protect ourselves as the climate worsens. Among the many benefits we can look forward to are avoiding volatile gas prices while driving cleaner, quieter cars; faster and more controllable cooking while eliminating toxic indoor air; and air conditioning and heating without having to make two investments while paying less.
To better adapt, we’ll have a greener landscape, filtered air for rental homes, and community shelter hubs powered by microgrids to ride out more frequent extreme weather.
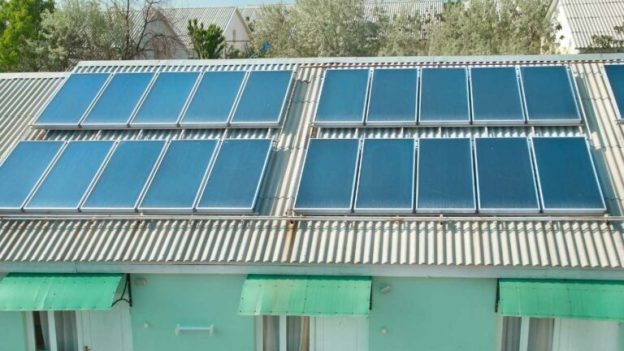
We have already seen that adding solar panels raises the value of a house by as much as $4,000 per installed kilowatt (so a 5 kilowatt system adds $20,000). We can expect similar increases in home values with these new technologies due to the future savings, safety and convenience.
Several state and federal laws and rules foretell what is coming. By 2045 California aims to be at zero net GHG emissions. That will require retiring all of the residential and commercial gas distribution lines. PG&E has already started a program to phase out its lines. A change in state rules will remove from the market several large natural gas appliances such as furnaces by 2030.
In addition, PG&E will no longer offer subsidies to developers to install gas lines to new homes starting next year. The U.S. Environmental Protection Agency appears poised to push further the use of electric appliances in areas with poor air quality such the Sacramento Valley. (Renewable gas and hydrogen will be too expensive and there won’t be enough to go around.)
Without sales to new customers or for replaced furnaces, the cost of maintaining the gas system will rise substantially so switching to electricity for cooking and water heating will save even more money. The CAAP anticipates this transition by having residents begin switching earlier.
In addition, the recently enacted federal Inflation Reduction Act offers between $400 and $800 billion into funding these types of changes. The California Energy Commission’s budget for this year went from $1 billion to $10 billion to finance these transitions. The CAAP lays out a process for acquiring these financial sources for Davis and its residents.
That said, some have objected to the CAAP as being too draconian and infringing on personal choices. The fact is that we are now in the midst of a climate emergency — the City Council endorsed this concern with a declaration in 2019. We’re already behind schedule to head off the worst of the threatening impacts.
We won’t be able to rely solely on voluntary actions to achieve the reductions we need. That the CAAP has to include these actions proves that people have not been acting on their own despite a decade of cajoling since the last CAAP. While we’ve been successful at encouraging voluntary compliance with easy tasks like recycling, we’ve used mandatory permitting requirements to gain compliance with various building standards including energy efficiency measures. (These are usually enforced at point-of-sale of a house.)
We have a choice of mandatory ordinances, incentives through taxes or fees, and subsidies from grants and funds — voluntary just won’t deliver what’s needed. We might be able to financially help those least able to afford changing stoves, heaters or cars, but those funds will be limited. The ability to raise taxes or fees is restricted due to various provisions in the state’s constitution. So we are left with mandatory measures, applied at the most opportune moments.
Switching to electricity for cooking and water heating may involve some costs, some or most of which will be offset by lower energy costs (especially as gas rates go up.) If you have an air conditioner, you’re likely already set up for a heat pump to replace your furnace — it’s a simple swap. Even so, you can avoid some costs by using a 120-volt induction cooktop instead of 240 volts, and installing a circuit-sharing plug or breaker for large loads to avoid panel upgrades.
The CAAP will be fleshed out and evolve for at least the next decade. Change is coming and will be inevitable given the dire situation. But this change gives us opportunities to clean our environment and make our city more livable.