The renewables policy team at Lawrence Berkeley National Laboratory (LBNL) released a study maintaining that it identifies the primary drivers of rate increases in the U.S. LBNL also issued a set of slides summarizing the study but there discrepancies between the two. (This post focuses on the study.)
First, this group of authors have been important leaders in tracking technology costs and resource alternatives at a micro level. You can find many of their studies cited in my various posts on renewables and distributed energy resources (DER). This time the authors may have stretched a bit too far.
Unfortunately this study is much more about correlation than causality. The authors hint at a more complex story that would require much more sophisticated regression analysis (e.g., two or three stage and fixed effects regressions) to untangle. Yet the report uses the term “driver” numerous places when “correlation” or “association” would be more appropriate.
Observations about Table 2 that displays the regression results and the discussion about findings in Section 4:
- 4.2 Price trends varied by state: Prices rose in states that are internalizing environmental and other costs while states with falling rates were continuing to impose environmental hazards and other costs on their citizens as a subsidy to utility shareholders.
- 4.4 Finding that rising growth decreases rates (load delta): This finding confuses a shift in customer composition with overall causality. The study found it was rising commercial loads, not overall loads, that decreased rates. That means the share of lower cost commercial customers increased, so, of course, the average rate decreased. The residential rates were unchanged statistically.
- 4.5 Behind the meter (BTM) solar: the most egregious error. The authors acknowledge this issue is problematic with many different viewpoints, but then plow ahead anyway. Customers find the most effective way to respond to rising rates is to install their own generation. This is classic economic cause and effect, yet the authors run a model assuming the reverse.
The problem is that they accept as given the utility narrative that rooftop customers are shirking cost responsibility while ignore the cost saving from serving load themselves. The authors also buy into the false narrative that utilities have substantial “fixed” costs—every other industry that has large fixed costs recover those through variable charges. That the BTM variable is strongly negative for the 2017-22 period and then positive for 2019-24 is an analytic red flag. (The negative value for the RPS effect from 2016-2021 just as California’s most expensive renewables came on line compared to the other periods is another red flag in the regression analysis overall.)
Our analysis shows instead how California NEM customers have saved money for other customers. The authors do not include that critique of the studies done in California in their citations. We also deeply critiqued the E3 study of Washington’s NEM program, finding numerous analytic and conceptual errors. (Ahmad Faruqui would disavow his Sergici et al 2019 study included as a supporting citation in the LBNL study.)

There are two fundamental conceptual errors in these underlying analyses that the LBNL authors rely on: 1) that utilities have the right to serve 100% of customer loads and customers must pay for the privilege to self serve with their own generation, and 2) that utilities are entitled to full recovery of all of their costs even when sales decrease. Neither of these premises hold in any other industry (even natural gas and water utilities).
Notably they found no statistical effect from energy efficiency programs yet the impacts on utility sales and revenues are identical to BTM solar. No one is calling for customers who install LED lighting, insulation or more efficient appliances to increase their contribution utility revenue requirements to be “fair.” The one difference is that DERs present the opportunity to truly “cut the cord” with the utility if rates become excessive. This is further evidence that this finding that rooftop solar unduly raises the rates for other customers is false and misleading.
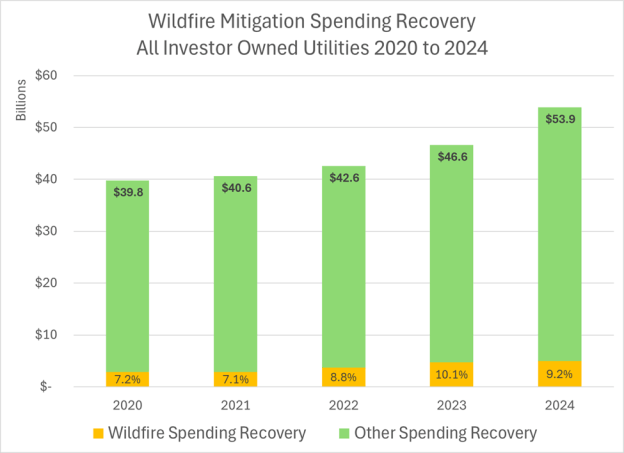
- 4.9 Wildfire spending as a source of cost increases: the authors attribute a 6 cents/kWh increase in California wildfire spending. That’s incorrect (the PAO took PG&E’s assertion without checking it) as we have tracked the total utility spending—it’s only about 10% or less than 4 cents/kWh of IOU rates. But a portion of that increase already happened prior to 2019, and the wildfire bond adder wasn’t an increase but rather a repurposing of an existing bond cost recovery charge. The rate increase attributable to wildfire spending is less than 3 cents on a statewide basis (rolling in the municipals, e.g., LADWP & SMUD).
The real reason for California rate increases are: 1) unusual exposure to natural gas prices because the IOUs have not hedged power purchases 2) increase in resource adequacy prices because of multiple changes in how this handled (the underlying reason being to squeeze CCAs), 3) unregulated spending in distribution infrastructure the IOUs starting in 2010 and 3) a 150% increase in transmission investment to deliver grid scale renewable generation since 2012.