A recent post at the Energy Institute at Haas proposed that all residential ratepayers should pay the “solar tax” in the recently withdrawn proposed decision from the California Public Utilities Commission through a connection fee. I agree that charging residential a connection charge is a reasonable solution. (All commercial and agricultural customers in California already pay such a charge.) The more important question though is what that connection fee should be?
Much less of the distribution costs are “fixed” than many proponents understand–we can see an example of the ability to avoid large undergrounding costs by installing microgrids as an example. Southern California Edison has repeatedly asked for a largely fixed “grid charge” for the last dozen years and the intervening ratepayer groups have shown that SCE’s estimate is much too high. A service connection costs about $10-$15/month, not more than $50 per month. So what might be the other elements of a fixed monthly charge rather than collecting these revenues through a volumetric rate as is done today?
A strong economic argument can be made that if the utility is collecting a fixed charge for upstream T&D capacity, then a customer should be able to trade that capacity that they have paid for with other customers. In the face of transaction costs, that market would devolve down to the per kWh price managed by the utility acting as a dealer–just what we have today.
Other candidates abound. How to recover stranded costs really requires a conversation about how much of those costs shareholders should shoulder. Income distributional public purpose costs should be collected from taxes, not rates. Energy efficiency is a resource that should be charged in the generation component, not distribution, and should be treated like other generation resources in cost recovery. The problem is that decoupling which was used to encourage energy efficiency investment has become a backdoor way to recover stranded costs without any conversation about whether that is appropriate–rates go up as demand decreases with little reduction in revenue requirements. So what the connection charge should be becomes quite complex.
There is a general understanding among the most informed participants and observers that California’ net energy metering (NEM) tariff as originally conceived was not intended to be a permanent fixture. The objective of the NEM rate was to get a nascent renewable energy industry off the ground and now California has more than 11,000 megawatts of distributed solar generation. Now that the distributed energy resources industry is in much less of a need for subsidies, but its full value also must be recognized. To this end it is important to understand some key facts that are sometimes overlooked in the debate.
The true underlying reason for high rates–rising utility revenue requirements
In California, retail electricity rates are so high for two reasons, the first being stranded generation costs and the second being a bunch of “public goods charges” that constitute close to half of the distribution cost. PG&E’s rates have risen 57% since 2009. Many, if not most, NEM customers have installed solar panels as one way to avoid these rising rates. The thing is when NEM 1.0 and 2.0 were adopted, the cost of the renewable power purchase agreements (PPA) portfolios were well over $100/MWH—even $120MWH through 2019, and adding in the other T&D costs, this approached the average system rate as late as 2019 for SCE and PG&E before their downward trends reversed course. That the retail rate skyrocketed while renewable PPAs fell dramatically is a subsequent development that too many people have forgotten.
California uses Ramsey pricing principles to allocate these (the CPUC applies “equal percent marginal costs” or EPMC as a derivative measure), but Ramsey pricing was conceived for one-way pricing. I don’t know what Harold Hotelling would think of using his late student’s work for two way transactions. This is probably the fundamental problem in NEM rates—the stranded and public goods costs are incurred by one party on one side of the ledger (the utility) but the other party (the NEM customer) doesn’t have these same cost categories on the other side of the ledger; they might have their own set of costs but they don’t fall into the same categories. So the issue is how to set two way rates given the odd relationships of these costs and between utilities and ratepayers.
This situation argues for setting aside the stranded costs and public goods to be paid for in some manner other than electric rates. The answer can’t be in a form of a shift of consumption charges to a large access charge (e.g., customer charge) because customers will just leave entirely when half of their current bill is rolled into the new access charge.
The largest nonbypassable charge (NBC), now delineated for all customers, is the power cost indifference adjustment (PCIA). The PCIA is the stranded generation asset charge for the portfolio composed of utility-scale generation. Most of this is power purchase agreements (PPAs) signed within the last decade. For PG&E in 2021 according to its 2020 General Rate Case workpapers, this exceeded 4 cents per kilowatt-hour.
Basic facts about the grid
The grid is not a static entity in which there are no changes going forward. Yet the cost of service analysis used in the CPUC’s recent NEM proposed decision assumes that posture. Acknowledging that the system will change going forward depending on our configuration decisions is an important key principle that is continually overlooked in these discussions.
In California, a customer is about 15 times more likely to experience an outage due to distributionsystem problems than from generation/transmission issues. That means that a customer who decides to rely on self-provided resources can have a set up that is 15 times less reliable than the system grid and still have better reliability than conventional service. This is even more true for customers who reside in rural areas.
Upstream of the individual service connection (which costs about $10 per month for residential customers based on testimony I have submitted in all three utilities’ rate cases), customers share distribution grid capacity with other customers. They are not given shares of the grid to buy and sell with other customers—we leave that task to the utilities who act as dealers in that market place, owning the capacity and selling it to customers. If we are going to have fixed charges for customers which essentially allocated a capacity share to each of them, those customers also should be entitled to buy and sell capacity as they need it. The end result will be a marketplace which will price distribution capacity on either a daily $ per kilowatt or cents per kilowatt-hour basis. That system will look just like our current distribution pricing system but with a bunch of unnecessary complexity.
This situation is even more true for transmission. There most certainly is not a fixed share of the transmission grid to be allocated to each customer. Those shares are highly fungible.
What is the objective of utility regulation: just and reasonable rates or revenue assurance?
At the core of this issue is the question of whether utility shareholders are entitled to largely guaranteed revenues to recover their investments. In a market with some level of competitiveness, the producers face a degree of risk under normal functional conditions (more mundane than wildfire risk)—that is not the case with electric utilities, at least in California. (We cataloged the amount of disallowances for California IOUs in the 2020 cost of capital applications and it was less than one one-hundredth of a percent (0.01%) of revenues over the last decade.) When customers reduce or change their consumption patterns in a manner that reduces sales in a normal market, other customers are not required to pick up the slack—shareholders are. This risk is one of the core benefits of a competitive market, no matter what the degree of imperfection. Neither the utilities or the generators who sell to them under contract face these risks.
Why should we bother with “efficient” pricing if we are pushing the entire burden of achieving that efficiency on customers who have little ability to alter utilities’ investment decisions? Bottom line: if economists argue for “efficient” pricing, they need to also include in that how utility shareholders will participate directly in the outcomes of that efficient pricing without simply shifting revenue requirements to other customers.
As to the intent of the utilities, in my 30 year on the ground experience, the management does not make decisions that are based on “doing good” that go against their profit objective. There are examples of each utility choosing to gain profits that they were not entitled to. We entered into testimony in PG&E’s 1999 GRC a speech by a PG&E CEO talking about how PG&E would exploit the transition period during restructuring to maintain market share. That came back to haunt the state as it set up the conditions for ensuing market manipulation.
Each of these issues have been largely ignored in the debate over what to do about solar rooftop policy and investment going forward. It is time to push these to fore.
I read these two statements in his blog post and come to a very different conclusions:
“(I)ndividuals and businesses make investments in response to those policies, and many come to believe that they have a right to see those policies continue indefinitely.”
Why wasn’t there a similar cry against bailing out PG&E in not one but TWO bankruptcies? Both PG&E and SCE have clearly relied on the belief that they deserve subsidies to continue staying in business. (SCE has ridden along behind PG&E in both cases to gain the spoils.) The focus needs to be on ALL players here if these types of subsidies are to be called out.
“(T)he reactions have largely been about how much subsidy rooftop solar companies in California need in order to stay in business.”
We are monitoring two very different sets of media then. I see much more about the ability of consumers to maintain an ability to gain a modicum of energy independence from large monopolies that compel that those consumers buy their service with no viable escape. I also see a reactions about how this will undermine directly our ability to reduce GHG emissions. This directly conflicts with the CEC’s Title 24 building standards that use rooftop solar to achieve net zero energy and electrification in new homes.
Yes, there are problems with the current compensation model for NEM customers, but we also need to recognize our commitments to customers who made investments believing they were doing the right thing. We need to acknowledge the savings that they created for all of us and the push they gave to lower technology costs. We need to recognize the full set of values that these customers provide and how the current electric market structure is too broken to properly compensate what we want customers to do next–to add more storage. Yet, the real first step is to start at the source of the problem–out of control utility costs that ratepayers are forced to bear entirely.
The saying goes “No good deed goes unpunished.” The California Public Utilities Commission seems to have taken that motto to heart recently, and stands ready to penalize yet another group of customers who answered the clarion call to help solve the state’s problems by radically altering the rules for solar rooftops. Here’s three case studies of recent CPUC actions that undermine incentives for customers to act in the future in response to state initiatives: (1) farmers who invested in response to price incentives, (2) communities that pursued renewables more assertively, and (3) customers who installed solar panels.
Agriculture: Farmers have responded to past time of use (TOU) rate incentives more consistently and enthusiastically than any other customer class. Instead of being rewarded for their consistency, their peak price periods shifted from the afternoon to the early evening. Growers face much more difficulty in avoiding pumping during that latter period.
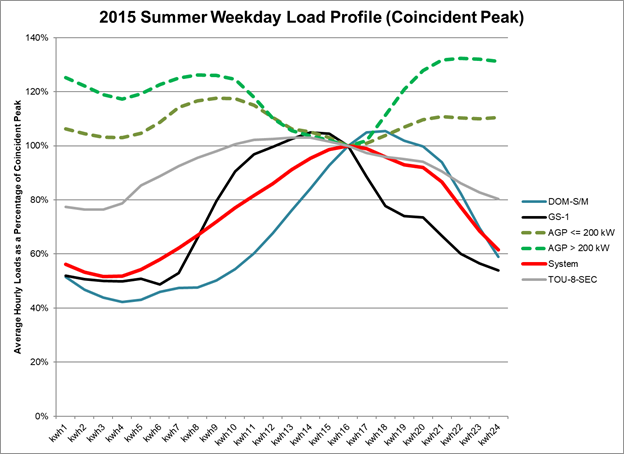
Since TOU rates were introduced to agricultural customers in the late 1970s, growers have made significant operational changes in response to TOU differentials between peak and off-peak energy prices to minimize their on-peak consumption. These include significant investments in irrigation equipment, storage and conveyance infrastructure and labor deployment rescheduling. The results of these expenditures are illustrated in the figure below, which shows how agricultural loads compare with system-wide load on a peak summer weekday in 2015, contrasting hourly loads to the load at the coincident peak hour. Both the smaller and larger agricultural accounts perform better than a range of representative rate schedules. Most notably agriculture’s aggregate load shape on a summer weekday is inverted relative to system peak, i.e., the highest agricultural loads occur during the lowest system load periods, in contrast with other rate classes.
All other rate schedules shown in the graphic hit their annual peak on the same peak day within the then-applicable peak hours of noon to 6 p.m. In contrast, agriculture electricity demand is less than 80% of its annual peak during those high-load hours, with its daily peak falling outside the peak period. Agriculture’s avoidance of peak hours occurred during the summer agricultural growing season, which coincided with peak system demand—just as the Commission asked customers to do. The Commission could not ask for a better aggregate response to system needs; in contrast to the profiles for all of the other customer groups, agriculture has significantly contributed to shifting the peak to a lower cost evening period.
The significant changes in the peak period price timing and differential that the CPUC adopted increases uncertainty over whether large investments in high water-use efficiency microdrip systems – which typically cost $2,000 per acre–will be financially viable. Microdrip systems have been adopted widely by growers over the last several years—one recent study of tomato irrigation rates in Fresno County could not find any significant quantity of other types of irrigation systems. Such systems can be subject to blockages and leaks that are only detectable at start up in daylight. Growers were able to start overnight irrigation at 6 p.m. under the legacy TOU periods and avoid peak energy use. In addition, workers are able to end their day shortly after 6 p.m. and avoid nighttime accidents. Shifting that load out of the peak period will be much more difficult to do with the peak period ending after sunset.
Contrary to strong Commission direction to incent customers to avoid peak power usage, the shift in TOU periods has served to penalize, and reverse, the great strides the agricultural class has made benefiting the utility system over the last four decades.
Community choice aggregators: CCAs were created, among other reasons, to develop more renewable or “green” power. The state achieved its 2020 target of 33% in large part because of the efforts of CCAs fostered through offerings of 50% and 100% green power to retail customers. CCAs also have offered a range of innovative programs that go beyond the offerings of PG&E, SCE and SDG&E.
Nevertheless, the difficulty of reaching clean energy goals is created by the current structure of the PCIA. The PCIA varies inversely with the market prices in the market–as market prices rise, the PCIA charged to CCAs and direct access (DA) customers decreases. For these customers, their overall retail rate is largely hedged against variation and risk through this inverse relationship.
The portfolios of the incumbent utilities are dominated by long-term contracts with renewables and capital-intensive utility-owned generation. For example, PG&E is paying a risk premium of nearly 2 cents per kilowatt-hour for its investment in these resources. These portfolios are largely impervious to market price swings now, but at a significant cost. The PCIA passes along this hedge through the PCIA to CCAs and DA customers which discourages those latter customers from making their own long term investments. (I wrote earlier about how this mechanism discouraged investment in new capacity for reliability purposes to provide resource adequacy.)
The legacy utilities are not in a position to acquire new renewables–they are forecasting falling loads and decreasing customers as CCAs grow. So the state cannot look to those utilities to meet California’s ambitious goals–it must incentivize CCAs with that task. The CCAs are already game, with many of them offering much more aggressive “green power” options to their customers than PG&E, SCE or SDG&E.
But CCAs place themselves at greater financial risk under the current rules if they sign more long-term contracts. If market prices fall, they must bear the risk of overpaying for both the legacy utility’s portfolio and their own.
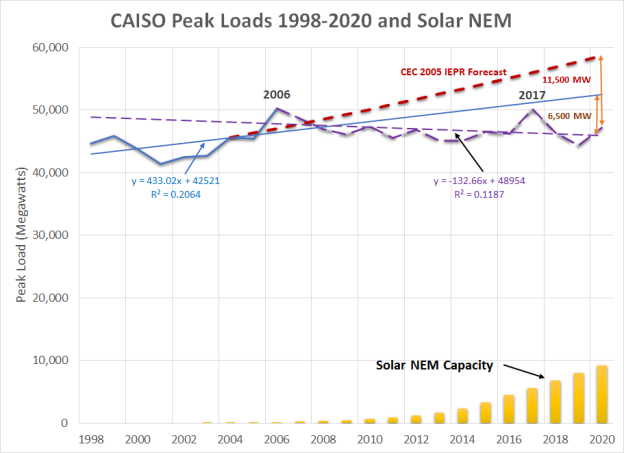
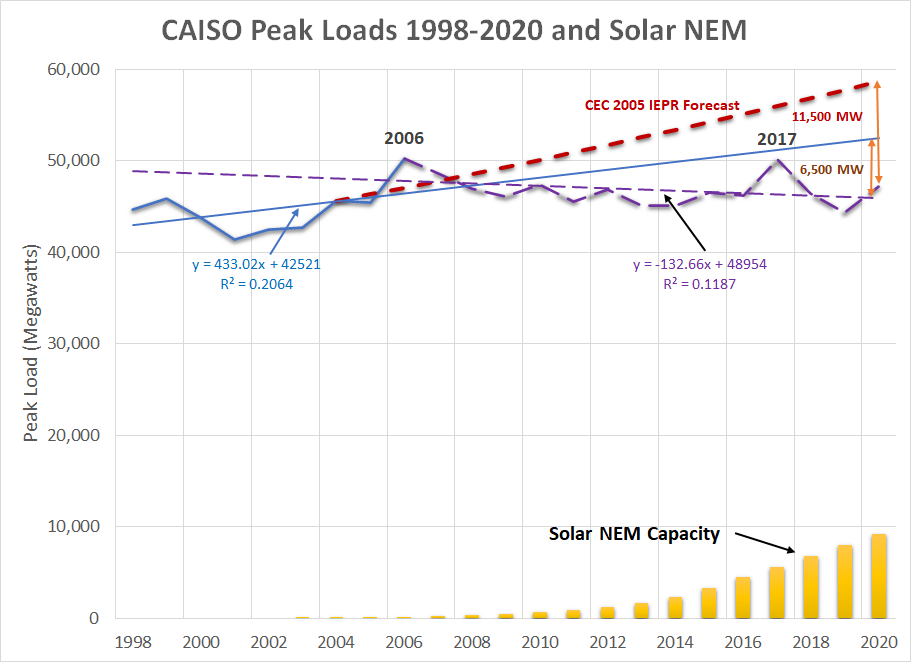
Solar net energy metered customers: Distributed solar generation installed under California’s net energy metering (NEM/NEMA) programs has mitigated and even eliminated load and demand growth in areas with established customers. This benefit supports protecting the investments that have been made by existing NEM/NEMA customers. Similarly, NEM/NEMA customers can displace investment in distribution assets. That distribution planners are not considering this impact appropriately is not an excuse for failing to value this benefit. For example, PG&E’s sales fell by 5% from 2010 to 2018 and other utilities had similar declines. Peak loads in the CAISO balancing authority reach their highest point in 2006 and the peak in August 2020 was 6% below that level.
Much of that decrease appears to have been driven by the installation of rooftop solar. The figure above illustrates the trends in CAISO peak loads in the set of top lines and the relationship to added NEM/NEMA installations in the lower corner. It also shows the CEC’s forecast from its 2005 Integrated Energy Policy Report as the top line. Prior to 2006, the CAISO peak was growing at annual rate of 0.97%; after 2006, peak loads have declined at a 0.28% trend. Over the same period, solar NEM capacity grew by over 9,200 megawatts. The correlation factor or “R-squared” between the decline in peak load after 2006 and the incremental NEM additions is 0.93, with 1.0 being perfect correlation. Based on these calculations, NEM capacity has deferred 6,500 megawatts of capacity additions over this period. Comparing the “extreme” 2020 peak to the average conditions load forecast from 2005, the load reduction is over 11,500 megawatts. The obvious conclusion is that these investments by NEM customers have saved all ratepayers both reliability and energy costs while delivering zero-carbon energy.
The CPUC now has before it a rulemaking in which the utilities and some ratepayer advocates are proposing to not only radically reduce the compensation to new NEM/NEMA customers but also to change the terms of the agreements for existing ones.
One of the key principles of providing financial stability is setting prices and rates for long-lived assets such as solar panels and generation plants at the economic value when the investment decision was made to reflect the full value of the assets that would have been acquired otherwise. If that new resource had not been built, either a ratebased generation asset would have been constructed by the utility at a cost that would have been recovered over a standard 30-year period or more likely, additional PPAs would have been signed. Additionally, the utilities’ investments and procurement costs are not subject to retroactive ratemaking under the rule prohibiting such ratemaking and Public Utilities Code Section 728, thus protecting shareholders from any risk of future changes in state or Commission policies.
Utility customers who similarly invest in generation should be afforded at least the same assurances as the utilities with respect to protection from future Commission decisions that may diminish the value of those investments. Moreover, customers do not have the additional assurances of achieving a certain net income so they already face higher risks than utility shareholders for their investments.
Generators are almost universally afforded the ability to recover capital investments based on prices set for multiple years, and often the economic life of their assets. Utilities are able to put investments in ratebase to be recovered at a fixed rate of return plus depreciation over several decades. Third-party generators are able to sign fixed price contracts for 10, 20, and even 40 years. Some merchant generators may choose to sell only into the short-term “hourly” market, but those plants are not committed to selling whenever the CAISO demands so. Generators are only required to do so when they sign a PPA with an assured payment toward investment recovery.
Ratepayers who make investments that benefit all ratepayers over the long term should be offered tariffs that provide a reasonable assurance of recovery of those investments, similar to the PPAs offered to generators. Ratepayers should be able to gain the same assurances as generators who sign long-term PPAs, or even utilities that ratebase their generation assets, that they will not be forced to bear all of the risk of investing of clean self-generation. These ratepayers should have some assurance over the 20-plus year expected life of their generation investment.
Severin Borenstein at the Energy Institute at Haas has written another blog post asserting that solar rooftop rates are inefficient and must changed radically. (I previously responded to an earlier post.) When looking at the efficiency of NEM rates, we need to look carefully at several elements of electricity market and the overall efficiency of utility ratemaking. We can see that we can come to a very different conclusion.
I filed testimony in the NEM 3.0 rulemaking last month where I calculated the incremental cost of transmission investment for new generation and the reduction in the CAISO peak load that looks to be attributable to solar rooftop.
Using FERC Form 1 and CEC powerplant data, I calculated that the incremental cost of transmission is $37/MWH. (And this is conservative due to a couple of assumptions I made.) Interestingly, I had done a similar calculation for AEP in the PJM interconnect and also came up with $37/MWH. This seems to be a robust value in the right neighborhood.
Load growth in California took a distinct change in trend in 2006 just as solar rooftop installations gained momentum. I found a 0.93 correlation between this change in trend and the amount of rooftop capacity installed. Using a simple trend, I calculated that the CAISO load decreased 6,000 MW with installation of 9,000 MW of rooftop solar. Looking at the 2005 CEC IEPR forecast, the peak reduction could be as large as 11,000 MW. CAISO also estimated in 2018 that rooftop solar displaced in $2.6 billion in transmission investment.
When we look at the utilities’ cost to acquire renewables and add in the cost of transmission, we see that the claim that grid-scale solar is so much cheaper than residential rooftop isn’t valid. The “green” market price benchmark used to set the PCIA shows that the average new RPS contract price in 2016 was still $92/MWH in 2016 and $74/MWH in 2017. These prices generally were for 30 year contracts, so the appropriate metric for comparing a NEM investment is against the vintage of RPS contracts signed in the year the rooftop project was installed. For 2016, adding in the transmission cost of $37/MWH, the comparable value is $129/MWH and in 2017, $111/MWH. In 2016, the average retail rates were $149/MWH for SCE, $183/MWH for PG&E and $205/MWH for SDG&E. (Note that PG&E’s rate had jumped $20/MWH in 2 years, while SCE’s had fallen $20/MWH.) In a “rough justice” way, the value of the displaced energy via rooftop solar was comparable to the retail rates which reflect the value of power to a customer, at least for NEM 1.0 and 2.0 customers. Rooftop solar was not “multiples” of grid scale solar.
These customers also took on investment risk. I calculated the payback period for a couple of customers around 2016 and found that a positive payback was dependent on utility rates rising at least 3% a year. This was not a foregone conclusion at the time because retail rates had actually be falling up to 2013 and new RPS contract prices were falling as well. No one was proposing to guarantee that these customers recover their investments if they made a mistake. That they are now instead benefiting is unwarranted hubris that ignores the flip side of the importance of investment risk–that investors who make a good efficient decision should reap the benefits. (We can discuss whether the magnitude of those benefits are fully warranted, but that’s a different one about distribution of income and wealth, not efficiency.)
Claiming that grid costs are fixed immutable amount simply isn’t a valid claim. SCE has been trying unsuccessfully to enact a “grid charge” with this claim since at least 2006. The intervening parties have successfully shown that grid costs in fact are responsive to reductions in demand. In addition, moving to a grid charge that creates a “ratchet effect” in revenue requirements where once a utility puts infrastructure in place, it faces no risk for poor investment decisions. On the other hand the utility can place its costs into ratebase and raise rates, which then raises the ratchet level on the fixed charge. One of the most important elements of a market economy that leads to efficient investment is that investors face the risk of not earning a return on an investment. That forces them to make prudent decisions. A “ratcheted” grid charge removes this risk even further for utilities. If we’re claiming that we are creating an “efficient” pricing policy, then we need to consider all sides of the equation.
The point that 50% of rooftop solar generation is used to offset internal use is important–while it may not be exactly like energy efficiency, it does have the most critical element of energy efficiency. That there are additional requirements to implement this is of second order importance, Otherwise we would think of demand response that uses dispatch controls as similarly distinct from EE. Those programs also require additional equipment and different rates. But in fact we sum those energy savings with LED bulbs and refrigerators.
An important element of the remaining 50% that is exported is that almost all of it is absorbed by neighboring houses and businesses on the same local circuit. Little of the power goes past the transformer at the top of the circuit. The primary voltage and transmission systems are largely unused. The excess capacity that remains on the system is now available for other customers to use. Whether investors should be able to recover their investment at the same annual rate in the face of excess capacity is an important question–in a competitive industry, the effective recovery rate would slow.
Finally, public purpose program (PPP) and wildfire mitigation costs are special cases that can be simply rolled up with other utility costs.
The majority of PPP charges are a form of a tax intended for income redistribution. That function is admirable, but it shows the standard problem of relying on a form of a sales tax to finance such programs. A sales tax discourages purchases which then reduces the revenues available for income transfers, which then forces an increase in the sales tax. It’s time to stop financing the CARE and FERA programs from utility rates.
Wildfire costs are created by a very specific subclass of customers who live in certain rural and wildlands-urban interface (WUI) areas. Those customers already received largely subsidized line extensions to install service and now we are unwilling to charge them the full cost of protecting their buildings. Once the state made the decision to socialize those costs instead, the costs became the responsibility of everyone, not just electricity customers. That means that these costs should be financed through taxes, not rates.
Again, if we are trying to make efficient policy, we need to look at the whole. It is is inefficient to finance these public costs through rates and it is incorrect to assert that there is an inefficient subsidy created if a set of customers are avoiding paying these rate components.
Severin Borenstein at the Energy Institure at Haas has plunged into the politics of devising policies for rooftop solar systems. I respond to two of his blog posts in two parts here, with Part 1 today. I’ll start by posting a link to my earlier blog post that addresses many of the assertions here in detail. And I respond to to several other additional issues here.
First, the claims of rooftop solar subsidies has two fallacious premises. First, it double counts the stranded cost charge from poor portfolio procurement and management I reference above and discussed at greater length in my blog post. Take out that cost and the “subsidy” falls substantially. The second is that solar hasn’t displaced load growth. In reality utility loads and peak demand have been flat since 2006 and even declining over the last three years. Even the peak last August was 3,000 MW below the record in 2017 which in turn was only a few hundred MW above the 2006 peak. Rooftop solar has been a significant contributor to this decline. Displaced load means displaced distribution investment and gas fired generation (even though the IOUs have justified several billion in added investment by forecasted “growth” that didn’t materialized.) I have documented those phantom load growth forecasts in testimony at the CPUC since 2009. The cost of service studies supposedly showing these subsidies assume a static world in which nothing has changed with the introduction of rooftop solar. Of course nothing could be further from the truth.
Second TURN and Cal Advocates have all be pushing against decentralization of the grid for decades back to restructuring. Decentralization means that the forums at the CPUC become less important and their influence declines. They have all fought against CCAs for the same reason. They’ve been fighting solar rooftops almost since its inception as well. Yet they have failed to push for the incentives enacted in AB57 for the IOUs to manage their portfolios or to control the exorbitant contract terms and overabundance of early renewable contracts signed by the IOUs that is the primary reason for the exorbitant growth in rates.
Finally, there are many self citations to studies and others with the claim that the authors have no financial interest. E3 has significant financial interests in studies paid for by utilities, including the California IOUs. While they do many good studies, they also have produced studies with certain key shadings of assumptions that support IOUs’ positions. As for studies from the CPUC, commissioners frequently direct the expected outcome of these. The results from the Customer Choice Green Book in 2018 is a case in point. The CPUC knows where it’s political interests are and acts to satisfy those interests. (I have personally witnessed this first hand while being in the room.) Unfortunately many of the academic studies I see on these cost allocation issues don’t accurately reflect the various financial and regulatory arrangements and have misleading or incorrect findings. This happens simply because academics aren’t involved in the “dirty” process of ratemaking and can’t know these things from a distance. (The best academic studies are those done by those who worked in the bowels of those agencies and then went to academics.)
We are at a point where we can start seeing the additional benefits of decentralized energy resources. The most important may be the resilience to be gained by integrating DERs with EVs to ride out local distribution outages (which are 15 times more likely to occur than generation and transmission outages) once the utilities agree to enable this technology that already exists. Another may be the erosion of the political power wielded by large centralized corporate interests. (There was a recent paper showing how increasing market concentration has led to large wealth transfers to corporate shareholders since 1980.) And this debate has highlighted the elephant in the room–how utility shareholders have escaped cost responsibility for decades which has led to our expensive, wasteful system. We need to be asking this fundamental question–where is the shareholders’ skin in this game? “Obligation to serve” isn’t a blank check.
The cost of transmission for new generation has become a more salient issue. The CAISO found that distributed generation (DG) had displaced $2.6 billion in transmission investment by 2018. The value of displacing transmission requirements can be determined from the utilities’ filings with FERC and the accounting for new power plant capacity. Using similar methodologies for calculating this cost in California and Kentucky, the incremental cost in both independent system operators (ISO) is $37 per megawatt-hour or 3.7 cents per kilowatt-hour in both areas. This added cost about doubles the cost of utility-scale renewables compared to distributed generation.
When solar rooftop displaces utility generation, particularly during peak load periods, it also displaces the associated transmission that interconnects the plant and transmits that power to the local grid. And because power plants compete with each other for space on the transmission grid, the reduction in bulk power generation opens up that grid to send power from other plants to other customers.
The incremental cost of new transmission is determined by the installation of new generation capacity as transmission delivers power to substations before it is then distributed to customers. This incremental cost represents the long-term value of displaced transmission. This amount should be used to calculate the net benefits for net energy metered (NEM) customers who avoid the need for additional transmission investment by providing local resources rather than remote bulk generation when setting rates for rooftop solar in the NEM tariff.
In California, transmission investment additions were collected from the FERC Form 1 filings for 2017 to 2020 for PG&E, SCE and SDG&E. The Wholesale Base Total Revenue Requirements submitted to FERC were collected for the three utilities for the same period. The average fixed charge rate for the Wholesale Base Total Revenue Requirements was 12.1% over that year. That fixed charge rate is applied to the average of the transmission additions to determine the average incremental revenue requirements for new transmission for the period. The plant capacity installed in California for 2017 to 2020 is calculated from the California Energy Commission’s “Annual Generation – Plant Unit”. (This metric is conservative because (1) it includes the entire state while CAISO serves only 80% of the state’s load and the three utilities serve a subset of that, and (2) the list of “new” plants includes a number of repowered natural gas plants at sites with already existing transmission. A more refined analysis would find an even higher incremental transmission cost.)
Based on this analysis, the appropriate marginal transmission cost is $171.17 per kilowatt-year. Applying the average CAISO load factor of 52%, the marginal cost equals $37.54 per megawatt-hour.
In Kentucky, Kentucky Power is owned by American Electric Power (AEP) which operates in the PJM ISO. PJM has a market in financial transmission rights (FTR) that values relieving the congestion on the grid in the short term. AEP files network service rates each year with PJM and FERC. The rate more than doubled over 2018 to 2021 at average annual increase of 26%.
Based on the addition of 22,907 megawatts of generation capacity in PJM over that period, the incremental cost of transmission was $196 per kilowatt-year or nearly four times the current AEP transmission rate. This equates to about $37 per megawatt-hour (or 3.7 cents per kilowatt-hour).
A response to Severin Borenstein’s post at UC Energy Institute where he posits a large subsidy flowing to NEM customers and proposes an income-based fixed charge as the remedy. Borenstein made the same proposal at a later CPUC hearing.
The CPUC is now considering reforming the current net energy metering (NEM) tariffs in the NEM 3.0 proceeding. And the State Legislature is considering imposing a change by fiat in AB 1139.
First, to frame this discussion, economists are universally guilty of status quo bias in which we (since I’m one) too often assume that changing from the current physical and institutional arrangement is a “cost” in an implicit assumption that the current situation was somehow arrived at via a relatively benign economic process. (The debate over reparations for slavery revolve around this issue.) The same is true for those who claim that NEM customers are imposing exorbitant costs on other customers.
There are several issues to be considered in this analysis.
1) In looking at the history of the NEM rate, the emergence of a misalignment between retail rates that compensate solar customers and the true marginal costs of providing service (which are much more than the hourly wholesales price–more on that later) is a recent event. When NEM 1.0 was established residential rates were on the order of 15 c/kWh and renewable power contracts were being signed at 12 to 15 c/kWh. In addition, the transmission costs were adding 2 to 4 c/kWh. This was the case through 2015; NEM 1.0 expired in 2016. NEM 2.0 customers were put on TOU rates with evening peak loads, so their daytime output is being priced at off peak rates midday and they are paying higher on peak rates for usage. This despite the fact that the difference in “marginal costs” between peak and off wholesale costs are generally on the order of a penny per kWh. (PG&E NEM customers also pay a $10/month fixed charge that is close to the service connection cost.) Calculating the net financial flows is more complicated and deserve that complex look than what can be captured in a simple back of the envelope calculation.
2) If we’re going to dig into subsidies, the first place to start is with utility and power plant shareholders. If we use the current set of “market price benchmarks” (which are problematic as I’ll discuss), out of PG&E’s $5.2 billion annual generation costs, over $2 billion or 40% are “stranded costs” that are subsidies to shareholders for bad investments. In an efficient marketplace those shareholders would have to recover those costs through competitively set prices, as Jim Lazar of the Regulatory Assistance Project has pointed out. One might counter those long term contracts were signed on behalf of these customers who now must pay for them. Of course, overlooking whether those contracts were really properly evaluated, that’s also true for customers who have taken energy efficiency measures and Elon Musk as he moves to Texas–we aren’t discussing whether they also deserve a surcharge to cover these costs. But beyond this, on an equity basis, NEM 1.0 customers at least made investments based on an expectation, that the CPUC did not dissuade them of this belief (we have documentation of how at least one county government was mislead by PG&E on this issue in 2016). If IOUs are entitled to financial protection (and the CPUC has failed to enact the portfolio management incentive specified in AB57 in 2002) then so are those NEM customers. If on the other hand we can reopen cost recovery of those poor portfolio management decisions that have led to the incentive for retail customers to try to exit, THEN we can revisit those NEM investments. But until then, those NEM customers are no more subsidized than the shareholders.
3) What is the true “marginal cost”? First we have the problem of temporal consistency between generation vs. transmission and distribution grid (T&D) costs. Economists love looking at generation because there’s a hourly (or subhourly) “short run” price that coincides nicely with economic theory and calculus. On the other hand, those darn T&D costs are lumpy and discontinuous. The “hourly” cost for T&D is basically zero and the annual cost is not a whole lot better. The current methods debated in the General Rate Cases (GRC) relies on aggregating piecemeal investments without looking at changing costs as a whole. Probably the most appropriate metric for T&D is to calculate the incremental change in total costs by the number of new customers. Given how fast utility rates have been rising over the last decade I’m pretty sure that the “marginal cost” per customer is higher than the average cost–in fact by definition marginal costs must be higher. (And with static and falling loads, I’m not even sure how we calculated the marginal costs per kwh. We can derive the marginal cost this way FERC Form 1 data.) So how do we meld one marginal cost that might be on a 5-minute basis with one that is on a multi-year timeframe? This isn’t an easy answer and “rough justice” can cut either way on what’s the truly appropriate approximation.
4) Even if the generation cost is measured sub hourly, the current wholesale markets are poor reflections of those costs. Significant market distortions prevent fully reflecting those costs. Unit commitment costs are often subsidized through out of market payments; reliability regulation forces investment that pushes capacity costs out of the hourly market, added incremental resources–whether for added load such as electrification or to meet regulatory requirements–are largely zero-operating cost renewables of which none rely on hourly market revenues for financial solvency; in California generators face little or no bankruptcy risk which allows them to underprice their bids; on the flip side, capacity price adders such as ERCOT’s ORDC overprices the value of reliability to customers as a backdoor way to allow generators to recover investments through the hourly market. So what is the true marginal cost of generation? Pulling down CAISO prices doesn’t look like a good primary source of data.
We’re left with the question of what is the appropriate benchmark for measuring a “subsidy”? Should we also include the other subsidies that created the problem in the first place?
Assembly Bill 1139 is offered as a supposed solution to unaffordable electricity rates for Californians. Unfortunately, the bill would undermine the state’s efforts to reduce greenhouse gas emissions by crippling several key initiatives that rely on wider deployment of rooftop solar and other distributed energy resources.
It will make complying with the Title 24 building code requiring solar panel on new houses prohibitively expensive. The new code pushes new houses to net zero electricity usage. AB 1139 would create a conflict with existing state laws and regulations.
The state’s initiative to increase housing and improve affordability will be dealt a blow if new homeowners have to pay for panels that won’t save them money.
It will make transportation electrification and the Governor’s executive order aiming for 100% new EVs by 2035 much more expensive because it will make it much less economic to use EVs for grid charging and will reduce the amount of direct solar panel charging.
Rooftop solar was installed as a long-term resource based on a contractual commitment by the utilities to maintain pricing terms for at least the life of the panels. Undermining that investment will undermine the incentive for consumers to participate in any state-directed conservation program to reduce energy or water use.
If the State Legislature wants to reduce ratepayer costs by revising contractual agreements, the more direct solution is to direct renegotiation of RPS PPAs. For PG&E, these contracts represent more than $1 billion a year in excess costs, which dwarfs any of the actual, if any, subsidies to NEM customers. The fact is that solar rooftops displaced the very expensive renewables that the IOUs signed, and probably led to a cancellation of auctions around 2015 that would have just further encumbered us.
The bill would force net energy metered (NEM) customers to pay twice for their power, once for the solar panels and again for the poor portfolio management decisions by the utilities. The utilities claim that $3 billion is being transferred from customers without solar to NEM customers. In SDG&E’s service territory, the claim is that the subsidy costs other ratepayers $230 per year, which translates to $1,438 per year for each NEM customer. But based on an average usage of 500 kWh per month, that implies each NEM customer is receiving a subsidy of $0.24/kWh compared to an average rate of $0.27 per kWh. In simple terms, SDG&E is claiming that rooftop solar saves almost nothing in avoided energy purchases and system investment. This contrasts with the presumption that energy efficiency improvements save utilities in avoided energy purchases and system investments. The math only works if one agrees with the utilities’ premise that they are entitled to sell power to serve an entire customer’s demand–in other words, solar rooftops shouldn’t exist.
Finally, this initiative would squash a key motivator that has driven enthusiasm in the public for growing environmental awareness. The message from the state would be that we can only rely on corporate America to solve our climate problems and that we can no longer take individual responsibility. That may be the biggest threat to achieving our climate management goals.
The Energy Institute at Haas at the University of California published a study allegedly showing that electric vehicles are driven about only one-third of the average standard car in California. I responded with a response on the blog.
Catherine Wolfram writes, “But, we do not see any detectable changes in our results from 2014 to 2017, and some of the same factors were at play over this time period. This makes us think that newer data might not be dramatically different, but we don’t know.“
A recent study likely is delivering a biased estimate of future EV use. The timing of this study reminds me of trying to analyze cell phone use in the mid-2000s. Now household land lines are largely obsolete, and we use phones even more than we did then. The period used for the analysis was during a dramatically changing period more akin to solar panel evolution just before and after 2010, before panels were ubiquitous. We can see this evolution here for example. Comparing the Nissan Leaf, we can see that the range has increased 50% between the 2018 and 2021 models.
The primary reason why this data set is seeing such low mileage is because is almost certain that the vast majority of the households in the survey also have a standard ICE vehicle that they use for their extended trips. There were few or no remote fast charge stations during that time and even Tesla’s had limited range in comparison. In addition, it’s almost certain that EV households were concentrated in urban households that have a comparatively low VMT. (Otherwise, why do studies show that these same neighborhoods have low GHG emissions on average?) Only about one-third of VMT is associated with commuting, another third with errands and tasks and a third with travel. There were few if any SUV EVs that would be more likely to be used for errands, and EVs have been smaller vehicles until recently.
As for copurchased solar panel installation, these earlierstudies found that 40% or more of EV owners have solar panels, and solar rooftop penetration has grown faster than EV adoption since these were done.
I’m also not sure that the paper has captured fully workplace and parking structure charging. The logistical challenges of gaining LCFS credits could be substantial enough for employers and municipalities to not bother. This assumption requires a closer analysis of which entities are actually claiming these credits.
A necessary refinement is to compare this data to the typical VMT for these types of households, and to compare the mileage for model types. Smaller commuter models average less annual VMT according to the California Energy Commission’s vehicle VMT data set derived from the DMV registration file and the Air Resources Board’s EMFAC model. The Energy Institute analysis arrives at the same findings that EV studies in the mid 1990s found with less robust technology. That should be a flag that something is amiss in the results.