Tag Archives: cost of capital

Understanding core facts before moving forward with NEM reform

There is a general understanding among the most informed participants and observers that California’ net energy metering (NEM) tariff as originally conceived was not intended to be a permanent fixture. The objective of the NEM rate was to get a nascent renewable energy industry off the ground and now California has more than 11,000 megawatts of distributed solar generation. Now that the distributed energy resources industry is in much less of a need for subsidies, but its full value also must be recognized. To this end it is important to understand some key facts that are sometimes overlooked in the debate.

The true underlying reason for high rates–rising utility revenue requirements

In California, retail electricity rates are so high for two reasons, the first being stranded generation costs and the second being a bunch of “public goods charges” that constitute close to half of the distribution cost. PG&E’s rates have risen 57% since 2009. Many, if not most, NEM customers have installed solar panels as one way to avoid these rising rates. The thing is when NEM 1.0 and 2.0 were adopted, the cost of the renewable power purchase agreements (PPA) portfolios were well over $100/MWH—even $120MWH through 2019, and adding in the other T&D costs, this approached the average system rate as late as 2019 for SCE and PG&E before their downward trends reversed course. That the retail rate skyrocketed while renewable PPAs fell dramatically is a subsequent development that too many people have forgotten.

California uses Ramsey pricing principles to allocate these (the CPUC applies “equal percent marginal costs” or EPMC as a derivative measure), but Ramsey pricing was conceived for one-way pricing. I don’t know what Harold Hotelling would think of using his late student’s work for two way transactions. This is probably the fundamental problem in NEM rates—the stranded and public goods costs are incurred by one party on one side of the ledger (the utility) but the other party (the NEM customer) doesn’t have these same cost categories on the other side of the ledger; they might have their own set of costs but they don’t fall into the same categories. So the issue is how to set two way rates given the odd relationships of these costs and between utilities and ratepayers.

This situation argues for setting aside the stranded costs and public goods to be paid for in some manner other than electric rates. The answer can’t be in a form of a shift of consumption charges to a large access charge (e.g., customer charge) because customers will just leave entirely when half of their current bill is rolled into the new access charge.

The largest nonbypassable charge (NBC), now delineated for all customers, is the power cost indifference adjustment (PCIA). The PCIA is the stranded generation asset charge for the portfolio composed of utility-scale generation. Most of this is power purchase agreements (PPAs) signed within the last decade. For PG&E in 2021 according to its 2020 General Rate Case workpapers, this exceeded 4 cents per kilowatt-hour.

Basic facts about the grid

  • The grid is not a static entity in which there are no changes going forward. Yet the cost of service analysis used in the CPUC’s recent NEM proposed decision assumes that posture. Acknowledging that the system will change going forward depending on our configuration decisions is an important key principle that is continually overlooked in these discussions.
  • In California, a customer is about 15 times more likely to experience an outage due to distribution system problems than from generation/transmission issues. That means that a customer who decides to rely on self-provided resources can have a set up that is 15 times less reliable than the system grid and still have better reliability than conventional service. This is even more true for customers who reside in rural areas.
  • Upstream of the individual service connection (which costs about $10 per month for residential customers based on testimony I have submitted in all three utilities’ rate cases), customers share distribution grid capacity with other customers. They are not given shares of the grid to buy and sell with other customers—we leave that task to the utilities who act as dealers in that market place, owning the capacity and selling it to customers. If we are going to have fixed charges for customers which essentially allocated a capacity share to each of them, those customers also should be entitled to buy and sell capacity as they need it. The end result will be a marketplace which will price distribution capacity on either a daily $ per kilowatt or cents per kilowatt-hour basis. That system will look just like our current distribution pricing system but with a bunch of unnecessary complexity.
  • This situation is even more true for transmission. There most certainly is not a fixed share of the transmission grid to be allocated to each customer. Those shares are highly fungible.

What is the objective of utility regulation: just and reasonable rates or revenue assurance?

At the core of this issue is the question of whether utility shareholders are entitled to largely guaranteed revenues to recover their investments. In a market with some level of competitiveness, the producers face a degree of risk under normal functional conditions (more mundane than wildfire risk)—that is not the case with electric utilities, at least in California. (We cataloged the amount of disallowances for California IOUs in the 2020 cost of capital applications and it was less than one one-hundredth of a percent (0.01%) of revenues over the last decade.) When customers reduce or change their consumption patterns in a manner that reduces sales in a normal market, other customers are not required to pick up the slack—shareholders are. This risk is one of the core benefits of a competitive market, no matter what the degree of imperfection. Neither the utilities or the generators who sell to them under contract face these risks.

Why should we bother with “efficient” pricing if we are pushing the entire burden of achieving that efficiency on customers who have little ability to alter utilities’ investment decisions? Bottom line: if economists argue for “efficient” pricing, they need to also include in that how utility shareholders will participate directly in the outcomes of that efficient pricing without simply shifting revenue requirements to other customers.

As to the intent of the utilities, in my 30 year on the ground experience, the management does not make decisions that are based on “doing good” that go against their profit objective. There are examples of each utility choosing to gain profits that they were not entitled to. We entered into testimony in PG&E’s 1999 GRC a speech by a PG&E CEO talking about how PG&E would exploit the transition period during restructuring to maintain market share. That came back to haunt the state as it set up the conditions for ensuing market manipulation.

Each of these issues have been largely ignored in the debate over what to do about solar rooftop policy and investment going forward. It is time to push these to fore.
The scale economy myth of electric utilities

Vibrant Clean Energy released a study showing that inclusion of large amounts of distributed energy resources (DERs) can lower the costs of achieving 100% renewable energy. Commentors here have criticized the study for several reasons, some with reference to the supposed economies of scale of the grid.

While economies of scale might hold for individual customers in the short run, the data I’ve been evaluating for the PG&E and SCE general rate cases aren’t necessarily consistent with that notion. I’ve already discussed here the analysis I conducted in both the CAISO and PJM systems that show marginal transmission costs that are twice the current transmission rates. The rapid rise in those rates over the last decade are consistent with this finding. If economies of scale did hold for the transmission network, those rates should be stable or falling.

On the distribution side, the added investment reported in those two utilities’ FERC Form 1 are not consistent with the marginal costs used in the GRC filings. For example the added investment reported in Form 1 for final service lines (transmission, services, meters or TSM) appears to be almost 10 times larger than what is implied by the marginal costs and new customers in the GRC filings. And again the average cost of distribution is rising while energy and peak loads have been flat across the CAISO area since 2006. The utilities have repeatedly asked for $2 billion each GRC for “growth” in distribution, but given the fact that load has been flat (and even declining in 2019 and 2020), that means there’s likely a significant amount of stranded distribution infrastructure. If that incremental investment is for replacement (which is not consistent with either their depreciation schedules or their assertions about the true life of their facilties and the replacement costs within their marginal cost estimates), then they are grossly underestimating the future replacement cost for facilities which means they are underestimating the true marginal costs.

I can see a future replacement liability right outside my window. The electric poles were installed by PG&E 60+ years ago and the poles are likely reaching the end of their lives. I can see the next step moving to undergrounding the lines at a cost of $15,000 to $25,000 per house based on the ongoing mobilehome conversion program and the typical Rule 20 undergrounding project. Deferring that cost is a valid DER value. We will have to replace many services over the next several decades. And that doesn’t address the higher voltage parts of the system.

We have a counterexample of a supposed monopoly in the cable/internet system. I have at least two competing options where I live. The cell phone network also turned out not to be a natural monopoly. In an area where the PG&E and Merced ID service territories overlap, there are parallel distribution systems. The claim of a “natural monopoly” more likely is a legal fiction that protects the incumbent utility and is simpler for local officials to manage when awarding franchises.

If the claim of natural monopolies in electricity were true, then the distribution rate components for SCE and PG&E should be much lower than for smaller munis such as Palo Alto or Alameda. But that’s not the case. The cost advantages for SMUD and Roseville are larger than can be simply explained by differences in cost of capital. The Division/Office of Ratepayer Advocates critiqued a study by Christensen Associates for PG&E’s 1999 GRC that showed that the optimal utility size was about 500,000 customers. (PG&E’s witness Ken Train who was a professor at UC Berkeley inadvertently confirmed the results and Commissioner Richard Bilas, a Ph.D. economist, noted this in his proposed decision which was never adopted because it was short circuited by restructuring.) Given that finding, that means that the true marginal cost of a customer and associated infrastructure is higher than the average cost. The likely counterbalancing cause is an organizational diseconomy of scale that overwhelms the technological benefits of size.

Finally, generation no longer shows the economies of scale that dominated the industry. The modularity of combined cycle plants and the efficiency improvement of CTs started the industry down the rode toward the efficiency of “smallness.” Solar plants are similarly modular. The reason why additional solar generation appears so low cost is because much of that is from adding another set of panels to an existing plant while avoiding additional transmission interconnection costs (which is the lion’s share of the costs that create what economies of scale do exist.)

The VCE analysis looks a holistic long term analysis. It relies on long run marginal costs, not the short run MCs that will never converge on the LRMC due to the attributes of the electricity system as it is regulated. The study should be evaluated in that context.

Can Net Metering Reform Fix the Rooftop Solar Cost Shift?: A Response

A response to Severin Borenstein’s post at UC Energy Institute where he posits a large subsidy flowing to NEM customers and proposes an income-based fixed charge as the remedy. Borenstein made the same proposal at a later CPUC hearing.

The CPUC is now considering reforming the current net energy metering (NEM) tariffs in the NEM 3.0 proceeding. And the State Legislature is considering imposing a change by fiat in AB 1139.

First, to frame this discussion, economists are universally guilty of status quo bias in which we (since I’m one) too often assume that changing from the current physical and institutional arrangement is a “cost” in an implicit assumption that the current situation was somehow arrived at via a relatively benign economic process. (The debate over reparations for slavery revolve around this issue.) The same is true for those who claim that NEM customers are imposing exorbitant costs on other customers.

There are several issues to be considered in this analysis.

1) In looking at the history of the NEM rate, the emergence of a misalignment between retail rates that compensate solar customers and the true marginal costs of providing service (which are much more than the hourly wholesales price–more on that later) is a recent event. When NEM 1.0 was established residential rates were on the order of 15 c/kWh and renewable power contracts were being signed at 12 to 15 c/kWh. In addition, the transmission costs were adding 2 to 4 c/kWh. This was the case through 2015; NEM 1.0 expired in 2016. NEM 2.0 customers were put on TOU rates with evening peak loads, so their daytime output is being priced at off peak rates midday and they are paying higher on peak rates for usage. This despite the fact that the difference in “marginal costs” between peak and off wholesale costs are generally on the order of a penny per kWh. (PG&E NEM customers also pay a $10/month fixed charge that is close to the service connection cost.) Calculating the net financial flows is more complicated and deserve that complex look than what can be captured in a simple back of the envelope calculation.

2) If we’re going to dig into subsidies, the first place to start is with utility and power plant shareholders. If we use the current set of “market price benchmarks” (which are problematic as I’ll discuss), out of PG&E’s $5.2 billion annual generation costs, over $2 billion or 40% are “stranded costs” that are subsidies to shareholders for bad investments. In an efficient marketplace those shareholders would have to recover those costs through competitively set prices, as Jim Lazar of the Regulatory Assistance Project has pointed out. One might counter those long term contracts were signed on behalf of these customers who now must pay for them. Of course, overlooking whether those contracts were really properly evaluated, that’s also true for customers who have taken energy efficiency measures and Elon Musk as he moves to Texas–we aren’t discussing whether they also deserve a surcharge to cover these costs. But beyond this, on an equity basis, NEM 1.0 customers at least made investments based on an expectation, that the CPUC did not dissuade them of this belief (we have documentation of how at least one county government was mislead by PG&E on this issue in 2016). If IOUs are entitled to financial protection (and the CPUC has failed to enact the portfolio management incentive specified in AB57 in 2002) then so are those NEM customers. If on the other hand we can reopen cost recovery of those poor portfolio management decisions that have led to the incentive for retail customers to try to exit, THEN we can revisit those NEM investments. But until then, those NEM customers are no more subsidized than the shareholders.

3) What is the true “marginal cost”? First we have the problem of temporal consistency between generation vs. transmission and distribution grid (T&D) costs. Economists love looking at generation because there’s a hourly (or subhourly) “short run” price that coincides nicely with economic theory and calculus. On the other hand, those darn T&D costs are lumpy and discontinuous. The “hourly” cost for T&D is basically zero and the annual cost is not a whole lot better. The current methods debated in the General Rate Cases (GRC) relies on aggregating piecemeal investments without looking at changing costs as a whole. Probably the most appropriate metric for T&D is to calculate the incremental change in total costs by the number of new customers. Given how fast utility rates have been rising over the last decade I’m pretty sure that the “marginal cost” per customer is higher than the average cost–in fact by definition marginal costs must be higher. (And with static and falling loads, I’m not even sure how we calculated the marginal costs per kwh. We can derive the marginal cost this way FERC Form 1 data.) So how do we meld one marginal cost that might be on a 5-minute basis with one that is on a multi-year timeframe? This isn’t an easy answer and “rough justice” can cut either way on what’s the truly appropriate approximation.

4) Even if the generation cost is measured sub hourly, the current wholesale markets are poor reflections of those costs. Significant market distortions prevent fully reflecting those costs. Unit commitment costs are often subsidized through out of market payments; reliability regulation forces investment that pushes capacity costs out of the hourly market, added incremental resources–whether for added load such as electrification or to meet regulatory requirements–are largely zero-operating cost renewables of which none rely on hourly market revenues for financial solvency; in California generators face little or no bankruptcy risk which allows them to underprice their bids; on the flip side, capacity price adders such as ERCOT’s ORDC overprices the value of reliability to customers as a backdoor way to allow generators to recover investments through the hourly market. So what is the true marginal cost of generation? Pulling down CAISO prices doesn’t look like a good primary source of data.

We’re left with the question of what is the appropriate benchmark for measuring a “subsidy”? Should we also include the other subsidies that created the problem in the first place?

What is driving California’s high electricity prices?

This report by Next10 and the University of California Energy Institute was prepared for the CPUC’s en banc hearing February 24. The report compares average electricity rates against other states, and against an estimate of “marginal costs”. (The latter estimate is too low but appears to rely mostly on the E3 Avoided Cost Calculator.) It shows those rates to be multiples of the marginal costs. (PG&E’s General Rate Case workpapers calculates that its rates are about double the marginal costs estimated in that proceeding.) The study attempts to list the reasons why the authors think these rates are too high, but it misses the real drivers on these rate increases. It also uses an incorrect method for calculating the market value of acquisitions and deferred investments, using the current market value instead of the value at the time that the decisions were made.

We can explore the reasons why PG&E’s rates are so high, much of which is applicable to the other two utilities as well. Starting with generation costs, PG&E’s portfolio mismanagement is not explained away with a simple assertion that the utility bought when prices were higher. In fact, PG&E failed in several ways.

First, PG&E knew about the risk of customer exit as early as 2010 as revealed during the PCIA rulemaking hearings in 2018. PG&E continued to procure as though it would be serving its entire service area instead of planning for the rise of CCAs. Further PG&E also was told as early as 2010 (in my GRC testimony) that it was consistently forecasting too high, but it didn’t bother to correct thee error. Instead, service area load is basically at the save level that it was a decade ago.

Second, PG&E could have procured in stages rather than in two large rounds of request for offers (RFOs) which it finished by 2013. By 2011 PG&E should have realized that solar costs were dropping quickly (if they had read the CEC Cost of Generation Report that I managed) and that it should have rolled out the RFOs in a manner to take advantage of that improvement. Further, they could have signed PPAs for the minimum period under state law of 10 years rather than the industry standard 30 years. PG&E was managing its portfolio in the standard practice manner which was foolish in the face of what was occurring.

Third, PG&E failed to offer part of its portfolio for sale to CCAs as they departed until 2018. Instead, PG&E could have unloaded its expensive portfolio in stages starting in 2010. The ease of the recent RPS sales illustrates that PG&E’s claims about creditworthiness and other problems had no foundation.

I calculated the what the cost of PG&E’s mismanagement has been here. While SCE and SDG&E have not faced the same degree of exit by CCAs, the same basic problems exist in their portfolios.

Another factor for PG&E is the fact that ratepayers have paid twice for Diablo Canyon. I explain here how PG&E fully recovered its initial investment costs by 1998, but as part of restructuring got to roll most of its costs back into rates. Fortunately these units retire by 2025 and rates will go down substantially as a result.

In distribution costs, both PG&E and SCE requested over $2 billion for “new growth” in each of its GRCs since 2009, despite my testimony showing that growth was not going to materialize, and did not materialize. If the growth was arising from the addition of new developments, the developers and new customers should have been paying for those additions through the line extension rules that assign that cost responsibility. The utilities’ distribution planning process is opaque. When asked for the workpapers underlying the planning process, both PG&E and SCE responded that the entirety were contained in the Word tables in each of their testimonies. The growth projections had not been reconciled with the system load forecasts until this latest GRC, so the totals of the individual planning units exceeded the projected total system growth (which was too high as well when compared to both other internal growth projections and realized growth). The result is a gross overinvestment in distribution infrastructure with substantial overcapacity in many places.

For transmission, the true incremental cost has not been fully reported which means that other cost-effective solutions, including smaller and closer renewables, have been ignored. Transmission rates have more than doubled over the last decade as a result.

The Next10 report does not appear to reflect the full value of public purpose program spending on energy efficiency, in large part because it uses a short-run estimate of marginal costs. The report similarly underestimates the value of behind-the-meter solar rooftops as well. The correct method for both is to use the market value of deferred resources–generation, transmission and distribution–when those resources were added. So for example, a solar rooftop installed in 2013 was displacing utility scale renewables that cost more than $100 per megawatt-hour. These should not be compared to the current market value of less than $60 per megawatt-hour because that investment was not made on a speculative basis–it was a contract based on embedded utility costs.

PG&E’s bankruptcy—what’s happened and what’s next?

The wildfires that erupted in Sonoma County the night of October 8, 2017 signaled a manifest change not just limited to how we must manage risks, but even to the finances of our basic utility services. Forest fires had been distant events that, while expanding in size over the last several decades, had not impacted where people lived and worked. Southern California had experienced several large-scale fires, and the Oakland fire in 1991 had raced through a large city, but no one was truly ready for what happened that night, including Pacific Gas and Electric. Which is why the company eventually declared bankruptcy.

PG&E had already been punished for its poor management of its natural gas pipeline system after an explosion killed nine in San Bruno in 2010. The company was convicted in federal court, fined $3 million and placed on supervised probation under a judge.

PG&E also has extensive transmission and distribution network with more than 100,000 miles of wires. Over a quarter of that network runs through areas with significant wildfire risk. PG&E already had been charged with starting several forest fires, including the Butte fire in 2015, and its vegetation management program had been called out as inadequate by the California Public Utilities Commission (CPUC) since the 1990s. The  CPUC caught PG&E diverting $495 million from maintenance spending to shareholders from 1992 to 1997; PG&E was fined $29 million. Meanwhile, two other utilities, Southern California Edison (SCE) and San Diego Gas and Electric (SDG&E) had instituted several management strategies to mitigate wildfire risk (not entirely successful), including turning off “line reclosers” during high winds to avoid short circuits on broken lines that can spark fires. PG&E resisted such steps.

On that October night, when 12 fires erupted, PG&E’s equipment contributed to starting 11 of those, and indirectly at least to other. Over 100,000 acres burned, destroying almost 9,000 buildings and killing 44 people. It was the most destructive fire in history, costing over $14 billion.

But PG&E’s problems were not over. The next year in November 2018, an even bigger fire in Butte County, the Camp fire, caused by a failure of a PG&E transmission line. That one burned over 150,000 acres, killing 85, destroying the community of Paradise and costing $16 billion plus. PG&E now faced legal liabilities of over $30 billion, which exceeds PG&E’s invested capital in its system. PG&E was potentially upside down financially.

The State of California had passed Assembly Bill 1054 that provided a fund of $21 billion to cover excess wildfire costs to utilities (including SCE and SDG&E), but it only covered fires after 2018. The Wine Country and Camp fires were not included, so PG&E faced the question of how to pay for these looming costs. Plus PG&E had an additional problem—federal Judge William Alsup supervising its parole stepped in claiming that these fires were a violation of its parole conditions. The CPUC also launched investigations into PG&E’s safety management and potential restructuring of the firm. PG&E faced legal and regulatory consequences on multiple fronts.

PG&E Corp, the holding company, filed for Chapter 11 bankruptcy on January 14, 2019. PG&E had learned from its 2001 bankruptcy proceeding for its utility company subsidiary that moving its legal and regulatory issues into the federal bankruptcy court gave the company much more control over its fate than being in multiple forums. Bankruptcy law afforded the company the ability to force regulators to increase rates to cover the costs authorized through the bankruptcy. And PG&E suffered no real consequences with the 2001 bankruptcy as share prices returned, and even exceeded, pre-filing levels.

As the case progressed, several proposals, some included in legislative bills, were made to take control of PG&E from its shareholders, through a cooperative, a state-owned utility, or splitting it among municipalities. Governor Gavin Newsom even called on Warren Buffet to buy out PG&E. Several localities, including San Francisco, made separate offers to buy their jurisdictions’ grid. The Governor and CPUC made certain demands of PG&E to restructure its management and board of directors, to which PG&E responded in part. PG&E changed its chief executive officer, and its current CEO, Bill Johnson, will resign on June 30. The Governor holds some leverage because he must certify that PG&E has complied by June 30, 2020 with the requirements of Assembly Bill 1054 that authorizes the wildfire cost relief fund for the utilities.

Meanwhile, PG&E implemented a quick fix to its wildfire risk with “public safety power shutoffs” (PSPS), with its first test in October 2019, which did not fare well. PG&E was accused of being excessive in the number of customers (over 800,000) and duration and failing to coordinate adequately with local governments. A subsequent PSPS event went more smoothly, but still had significant problems. PG&E says that such PSPS events will continue for the next decade until it has sufficiently “hardened” its system to mitigate the fire risk. Such mitigation includes putting power lines underground, changing system configuration and installing “microgrids” that can be isolated and self sufficient for short durations. That program likely will cost tens of billions of dollars, potentially increasing rates as much as 50 percent. One question will be who should pay—all ratepayers or those who are being protected in rural areas?

PG&E negotiated several pieces of a settlement, coming to agreements with hedge-fund investors, debt holders, insurance companies that pay for wildfire losses by residents and businesses, and fire victims. The victims are to be paid with a mix of cash and stock, with a face value of $13.5 billion; the victims are voting on whether to accept this agreement as this article is being written. Local governments will receive $1 billion, and insurance companies $11 billion, for a total of $24.5 billion in payouts.  PG&E has lined up $20 billion in outside financing to cover these costs. The total package is expected to raise $58 billion.

The CPUC voted May 28 to approve PG&E’s bankruptcy plan, along with a proposed fine of $2 billion. PG&E would not be able to recover the costs for the 2017 and 2018 fires from ratepayers under the proposed order. The Governor has signaled that he is likely to also approve PG&E’s plan before the June 30 deadline.

PG&E is still asking for significant rate increases to both underwrite the AB 1054 wildfire protection fund and to implement various wildfire mitigation efforts. PG&E has asked for a $900 million interim rate increase for wildfire management efforts and a settlement agreement in its 2020 general rate case calls for another $575 million annual ongoing increase (with larger amounts to be added in the next three years). These amount to a more than 10 percent increase in rates for the coming year, on top of other rate increases for other investments.

And PG&E still faces various legal difficulties. The utility pleaded guilty to 85 chargesof manslaughter in the Camp fire, making the company a two-time felon. The federal judge overseeing the San Bruno case has repeatedly found PG&E’s vegetation management program wanting over the last two years and is considering remedial actions.

Going forward, PG&E’s rates are likely to rise dramatically over the next five years to finance fixes to its system. Until that effort is effective, PSPS events will be widespread, maybe for a decade. On top of that is that electricity demand has dropped precipitously due to the coronavirus pandemic shelter in place orders, which is likely to translate into higher rates as costs are spread over a smaller amount of usage.

Public takeover of PG&E isn’t going to solve every problem

This article in the Los Angeles Times about what a public takeover of PG&E appears to take on uses the premise that such a step would lead to lower costs, more efficiencies and reduced wildfire risks. These expectations have never been realistic, and shouldn’t be the motivation for such an action. Instead, a public takeover would offer these benefits and opportunities:

  • While the direct costs of constructing and repairing the grid would likely be about the same (and PG&E has some of the highest labor costs around), the cost to borrow and invest the needed funds would be as much as 30% less. That’s because PG&E weighted average cost of capital (debt and shareholder equity) is around 8% per annum while muncipal debt is 5% or less.
  • Ratepayers are already repaying shareholders and creditors for their investments in the utility system. Buying PG&E’s system would simply be replacing those payments with payments to creditors that hold public bonds. Similar to the cost of fixing the grid, this purchase should reduce the annual cost to repay that debt by 30%.
  • And along these lines, utility shareholders have borne little of the costs from these types of risks. Shareholders supposedly get a premium on their investment returns for these “risks” but when asked for examples of large scale disallowances, none of the utilities could provide significant examples. If ratepayers are already bearing all of those risks, then they should get all of the investment benefits as well.
  • Direct public oversight will eliminate a layer of regulation that PG&E has used to impede effective oversight and deflect responsibility. To some extent regulation by the California Public Utilities Commission has been like pushing on a string, with PG&E doing what it wants by “interpreting” CPUC decisions. The result has been a series of missteps by the utility over many decades.
  • A new utility structure may provide an opportunity to renegotiate a number of overly lucrative renewable power purchase agreements that PG&E signed between 2010 and 2015. PG&E failed to properly manage the risk profile of its portfolio because under state law it could pass through all costs of those PPAs once approved by the CPUC. PG&E’s shareholders bore no risk, so why consider that risk? There are several possible options to addressing this issue, but PG&E has little incentive to act.
  • A publicly-owned utility can work more closely with local governments to facilitate the evolution of the energy system to meet climate change challenges. As a private entity with restrictions on how it can participate in customer-side energy management, PG&E cannot work hand-in-glove with cities and counties on building and transportation transformation. PG&E right now has strong incentives to prevent further defections away from its grid; public utilities are more likely to accept these defections with the possibility that the stranded asset costs will be socialized.

The risks of wildfire damages and liabilities are unlikely to change substantially (except if the last point accelerates distributed energy resource investment). But the other benefits and opportunities are likely to make these costs lower.

Non-Profit Utilities Could Cure What Ails California Electricity

electricservicearea

Severin Borenstein at the Energy Institute at Haas, asks “Would Non-Profit Utilities Cure What Ails California Electricity?” I am posting my response here as that I find his post overlooks several important points and distinctions.

I’ll start by saying I wrote an op-ed in the Sacramento Bee in the early 2000s noting that creating a new municipal utility was not going to deliver the same low rates as existing munis and I’m still aware that such a transfer is unlikely to reduce rates much. But it does change the governance structure in a way that is likely to be more accountable and less influenced by the private interests of utility shareholders. Communities are joining together to push for acquisition of PG&E by a cooperative, which would have a similar governance structure to a municipal utility.

First, the complaint about government is largely about agencies that I will call “ministerial” or “administrative”. These agencies issue permits and licenses or provide social services. In contrast, the government agencies that deliver utility services, which are “enterprises” largely deliver service with few complaints. About 80% of water utilities and almost all wastewater utilities are publicly owned. I work in the water arena as well, and the only utility that I hear complaints about from customers is LADWP (both water and power sides). (The SDCWA-MWD fight is between agencies’ managements, not from customers). On the other hand, all three or California’s electric IOUs are the target of customers’ ire. And the IOU staffs (which I have frequent contact with) are no better than government employees in their responsiveness or competence. One advantage the enterprise agencies have over the ministerial/administrative ones is that they generally pay a higher salary so employees are motivated in much the same way as those in the private sector. Moving from oversight by a ministerial/administrative agency (CPUC) to management by an enterprise utility should overcome the problem of recruiting competent motivated staff.

Second, shareholders shoulder very little risk now, particularly in California. I testified in the IOUs’ rate of return case and we asked for the amount of disallowances that shareholders had to bear over the last two decades. Other than SDG&E’s 2007 wildfire costs due to negligence on the utility’s part, they came pack with amounts that were in the tens of millions, which amounts to less than a 0.1% of their revenues collected over that period. Utilities’ generation investment is now so protected that the CPUC reversed itself last year and removed the 10 year recovery cap from exit fees for generation that the utilities built knowing the cap existed. They are now getting bonus dollars! (Same thing happened with Diablo Canyon in 1996.) Yet the utilities are claiming in that rate case that the return on equity should be increased even further! I have a blog post about how the current return is already too high. (Part 2 is the next day.)  Public ownership in contrast can reduce the return on capital from close to 10% (before tax) to 5% or less, which can cut rates substantially.

We can see how PG&E in particular has been incompetently managed for decades. I posted about its many foibles since the 1960s as well. The supposed incentives and efficiencies of the private sector have failed to materialize for California utilities, and meanwhile we pay higher costs for capital with no real risk mitigation. (Ratepayers still had to pay for PG&E’s debts after the 2000-01 energy crisis, and it looks like the same may happen again.)

Finally, the question arises as to whether municipalizing piecemeal would create inequities. The premise of the statement is that the current economic distribution is equitable. But the fact is that rural residential customers in the wildland/urban interface (WUI) have not been paying their full share of their costs and have been heavily subsidized by urban customers. Those customers in the WUI tend to be better off than average (poor rural customers are more likely to live in agricultural communities that are not subject to the same fire risks and for whom service costs are lower), so we already have an adverse wealth transfer in place. And those subsidies have facilitated expansion of housing into those high risk areas that also encourage longer commutes with more GHG emissions.

The better question is how can the rural service areas be better served in the future without relying on the traditional utility structure? Moving toward microgrids and other DER solutions to improve reliability while reducing fire risk is one solution. Spending a $100 billion on undergrounding lines to be paid for by everyone else is NOT a good solution.

Utilities’ returns are too high (Part 2)

IOU ROE premiums

My previous post, Part 1, showed how California’s utilities’ share prices have risen well above the average across utilities despite claims that investors are risk averse to the California utilities. That valuation premium reflects an excessively high authorized return on equity (ROE) from the California Public Utilities Commission (CPUC).

The utilities’ market values can then be linked to the utilities’ book values and authorized returns on equity to calculate the implied market returns on equity. The authorized income per share is the authorized ROE multiplied by the book value per share. That income is divided by the market share price to arrive at the implied market return on equity for that company. Both Sempra (SRE) and Edison International (EIX) significantly outperform the Dow Jones Utility average and PG&E Corporation (PGC) maintained the same trend until market had significant concerns about the company’s role in the 2017 wildfires.

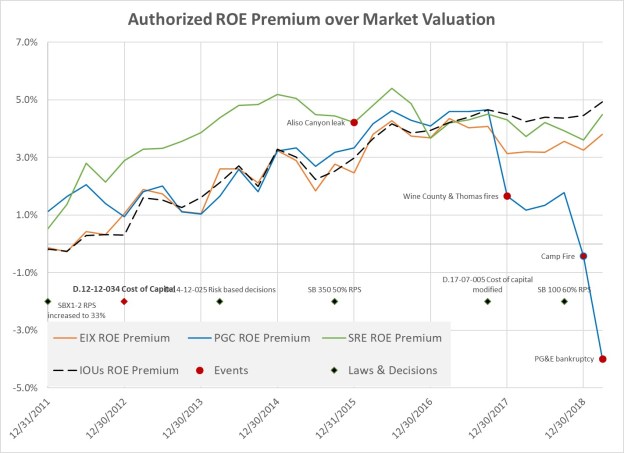
The figure above tracks the difference or premium value of the authorized ROE over the market valuation of that ROE. A premium value of zero means that the market valuation is on par with the authorized ROE. A higher or positive premium value means that investors see the utility’s equity shares as attractive investments with lower risks than the assessments of the commissions that set the authorized ROEs. In other words, a commission is providing an overly generous incentive to investors if the premium value is positive.  The figure above compares the market implied ROE for the three California holding companies to a market basket of 10 U.S. holding companies that own 17 electric and gas utilities, and do not own significant non-utility subsidiaries. 

At the time of the 2012 cost of capital decision, the authorized ROEs for the California utilities and the basket of U.S. utilities were close to the implied market ROEs. Except for Sempra, which was an outlier as evidenced by its share price growth relative to the other utilities, the authorized ROE was within 100 basis points of the implied market ROE at the end of 2012.  For both Edison International and PG&E Corporation, the authorized ROE and the implied market ROE on December 31, 2012 were exactly on par—10.5% for Edison and 10.4% for PG&E. Only Sempra showed a positive premium of 300 basis points as a result of a rapid increase in market value over 2012.

Over the period from 2012 to late 2017, the implied market ROEprogressed steadily downward–that is, the market value premium increased–for both the California utilities and the other U.S. utilities. Sempra’s premium leveled off in late 2014 and has drifted downward since without any significant corrections. SCE’s diverged upward some from the U.S. utilities mid-2016, but again there are not sharp changes in direction, even with the Thomas Fire in late 2017. PG&E followed the same pattern as SCE until the Wine Country fires in late 2017, and took another sharp turn with the Camp Fire and, understandably, the subsequent voluntary bankruptcy filing.

We can see at the end of September 2017, just after the last Commission decision on cost of capital, the market premium for the 10 utilities had grown to 470 basis points. The premiums for PG&E, Edison and Sempra all lied in a narrow band between 410 basis points for Edison and 470 basis points for PG&E. In other words, 1) California utility investors were receiving overly generous returns on their investments as evidenced in the share prices, and 2) California utility investors have not been demanding a significant discount for perceived increased risk compared to other U.S. utilities, contrary to the assertions by the utilities’ witnesses in this proceeding.


Utilities’ returns are too high (Part 1)

IOU share prices

An analysis of equity market activity indicates that investors have not priced a risk discount into California utility shares, and instead, until the recent wildfires, utility investors have placed a premium value on California utility stocks. This premium value indicates that investors have viewed California as either less risky than other states’ utilities or that California has provided a more lucrative return on investment than other states.

The California Public Utilities Commission (CPUC) should set the authorized return on equity to shareholders (ROE) to deliver an after-tax net income amount as a percentage of the capital invested by the utility or the “book value.” As Alfred Kahn wrote, “the sharp appreciation in the prices of public utility stocks, to one and half and then two times their book values during this period [the 1960s] reflected also a growing recognition that the companies in question were in fact being permitted to earn considerably more than their cost of capital.” (see footnote 69)

The book value is fairly stable and tends to grow over time as higher cost capital is invested to meet growth and to replace older, lower cost equipment. Investors use this forecasted income to determine their valuation of the company’s common stock in market transactions. Generally the accepted valuation is the net present value of the income stream using a discount rate equal to the expected return on that investment. That expected return represents the market-based return on equity or the implied market return.

Alfred Kahn wrote that a commission should generally target the ROE so that the book and market values of the utility company are roughly comparable. In that way, when the utility adds capital, that capital receives a return that closely matches the return investors expect in the market place. If the regulated ROE is low relative to the market ROE, the company will have difficulty raising sufficient capital from the market for needed investments. If the regulated ROE is high relative to the market ROE, ratepayers will pay too much for capital invested and excess economic resources will be diverted into the utility’s costs. On this premise, we compared each of the utilities’ market valuation and implied market ROE against market baskets of U.S. utilities and the current authorized ROEs.

The figure above shows how the stock price for each of the three California utility holding companies (PG&E Corporation (ticker symbol PCG), Edison International (EIX) and Sempra (SRE)) that own the four large California energy utilities. The figure compares these stock prices to the Dow Jones Utility index average from June 1998 to July 2019 starting from a common base index value of 100 on January 1, 2000. The chart also includes (a) important Commission decisions and state laws that have been enacted and are identified by several of the utility witnesses as increasing the legal and regulatory risk environment in the state, and (b) catastrophic events at particular utilities that could affect how investors perceive the risk and management of that utility.

Table 1 summarizes the annual average growth in share prices for the Dow Jones Utility average and the three holding companies up to the 2012 cost of capital decision, the 2017 cost of capital modification decision, and to July 2019. Also of particular note, the chart includes the Commission’s decision on incorporating a risk-based framework into each utility’s General Rate Case process in D.14-12-025. The significance of this decision is that the utility’s consideration of safety risk was directed to be “baked in” to future requests for new capital investment. The updated risk framework also has the impact of making new these new investments more secure from an investment perspective, since there is closer financial monitoring and tracking.

As you can see in both Table 1 and in the figure, the Dow Jones Utility average annual growth was 5.5% through July 13, 2017 and 5.8% through July 18, 2019, California utility prices exceeded this average in all but one case, with Edison’s shares rising 9.4% per annum through the first date and 8.4% through this July, and Sempra growing 15.2% to the first date and even more at 15.3% to the latest. Even PG&E grew at almost twice the index rate at 10.4% in 2017, and then took an expected sharp decline with its bankruptcy.

Table 1

Cumulative Average Growth from January 2000 12/12/2012 7/13/2017 7/18/2019
Dow Jones Utilities 3.9% 5.5% 5.8%
Edison International 7.2% 9.4% 8.4%
PG&E Corp. 8.6% 10.4% 2.4%
Sempra 15.8% 15.2% 15.3%

The chart and table support three important findings:

  • California utility shares have significantly outpaced industry average returns since January 2000 and since March 2009;
  • California share prices only decreased significantly after the wildfire events that have been tied to specific market-perceived negligence on the part of the electric utilities in 2017 and 2018; and
  • Other events and state policy actions do not appear to have a measurable sustained impact on utilities’ valuations.

In Part 2, I show how utilities’ premiums on their authorized ROE have grown over the last decade.

CPUC proposes radical restructuring of PG&E

104778251-gettyimages-861000956In PG&E’s safety order institution investigation (OII), outgoing CPUC President Michael Picker (along with senior administrative law judge Peter Allen) has put on the table four dramatic proposals to address governance and incentive issues at the utility. These proposals are:

  1. Separating PG&E into separate gas and electric utilities or selling the gas assets;
  2. Establishing periodic review of PG&E’s Certificate of Convenience and Necessity (CPCN);
  3. Modification or elimination of PG&E Corp.’s holding company structure; and
  4. Linking PG&E’s rate of return or return on equity to safety performance metrics.

The OII originally was opened to investigate PG&E’s management of its natural gas infrastructure, but the series of electricity-sparked wildfires reinfused the OII with a new direction. The proceeding has been a forum for various dramatic proposals on how to handle wildfire-related issues and PG&E’s subsequent bankruptcy filing.