An analysis of equity market activity indicates that investors have not priced a risk discount into California utility shares, and instead, until the recent wildfires, utility investors have placed a premium value on California utility stocks. This premium value indicates that investors have viewed California as either less risky than other states’ utilities or that California has provided a more lucrative return on investment than other states.
The California Public Utilities Commission (CPUC) should set the authorized return on equity to shareholders (ROE) to deliver an after-tax net income amount as a percentage of the capital invested by the utility or the “book value.” As Alfred Kahn wrote, “the sharp appreciation in the prices of public utility stocks, to one and half and then two times their book values during this period [the 1960s] reflected also a growing recognition that the companies in question were in fact being permitted to earn considerably more than their cost of capital.” (see footnote 69)
The book value is fairly stable and tends to grow over time as higher cost capital is invested to meet growth and to replace older, lower cost equipment. Investors use this forecasted income to determine their valuation of the company’s common stock in market transactions. Generally the accepted valuation is the net present value of the income stream using a discount rate equal to the expected return on that investment. That expected return represents the market-based return on equity or the implied market return.
Alfred Kahn wrote that a commission should generally target the ROE so that the book and market values of the utility company are roughly comparable. In that way, when the utility adds capital, that capital receives a return that closely matches the return investors expect in the market place. If the regulated ROE is low relative to the market ROE, the company will have difficulty raising sufficient capital from the market for needed investments. If the regulated ROE is high relative to the market ROE, ratepayers will pay too much for capital invested and excess economic resources will be diverted into the utility’s costs. On this premise, we compared each of the utilities’ market valuation and implied market ROE against market baskets of U.S. utilities and the current authorized ROEs.
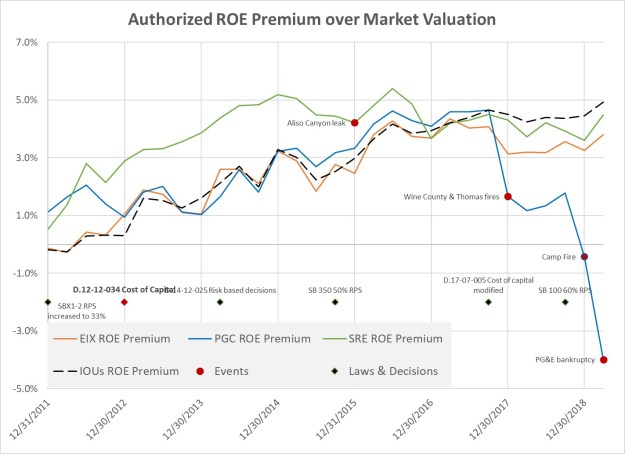
The figure above shows how the stock price for each of the three California utility holding companies (PG&E Corporation (ticker symbol PCG), Edison International (EIX) and Sempra (SRE)) that own the four large California energy utilities. The figure compares these stock prices to the Dow Jones Utility index average from June 1998 to July 2019 starting from a common base index value of 100 on January 1, 2000. The chart also includes (a) important Commission decisions and state laws that have been enacted and are identified by several of the utility witnesses as increasing the legal and regulatory risk environment in the state, and (b) catastrophic events at particular utilities that could affect how investors perceive the risk and management of that utility.
Table 1 summarizes the annual average growth in share prices for the Dow Jones Utility average and the three holding companies up to the 2012 cost of capital decision, the 2017 cost of capital modification decision, and to July 2019. Also of particular note, the chart includes the Commission’s decision on incorporating a risk-based framework into each utility’s General Rate Case process in D.14-12-025. The significance of this decision is that the utility’s consideration of safety risk was directed to be “baked in” to future requests for new capital investment. The updated risk framework also has the impact of making new these new investments more secure from an investment perspective, since there is closer financial monitoring and tracking.
As you can see in both Table 1 and in the figure, the Dow Jones Utility average annual growth was 5.5% through July 13, 2017 and 5.8% through July 18, 2019, California utility prices exceeded this average in all but one case, with Edison’s shares rising 9.4% per annum through the first date and 8.4% through this July, and Sempra growing 15.2% to the first date and even more at 15.3% to the latest. Even PG&E grew at almost twice the index rate at 10.4% in 2017, and then took an expected sharp decline with its bankruptcy.
Table 1
| Cumulative Average Growth from January 2000 |
12/12/2012 |
7/13/2017 |
7/18/2019 |
| Dow Jones Utilities |
3.9% |
5.5% |
5.8% |
| Edison International |
7.2% |
9.4% |
8.4% |
| PG&E Corp. |
8.6% |
10.4% |
2.4% |
| Sempra |
15.8% |
15.2% |
15.3% |
The chart and table support three important findings:
- California utility shares have significantly outpaced industry average returns since January 2000 and since March 2009;
- California share prices only decreased significantly after the wildfire events that have been tied to specific market-perceived negligence on the part of the electric utilities in 2017 and 2018; and
- Other events and state policy actions do not appear to have a measurable sustained impact on utilities’ valuations.
In Part 2, I show how utilities’ premiums on their authorized ROE have grown over the last decade.