Severin Borenstein wrote another blog attacking rooftop solar (a pet peeve of his at least a decade because these weren’t being installed in “optimal” locations in the state) entitled “Myths that Solar Owners Tell Themselves.” Unfortunately he set up a number of “strawman” arguments that really have little to do with the actual issues being debated right now at the CPUC. Here’s responses to each his “myths”:
Myth #1 – Customers are paid only 4 cents per kWh for exports: He’s right in part, but then he ignores the fact that almost all of the power sent out from rooftop panels are used by their neighbors and never gets to the main part of the grid. The utility is redirecting the power down the block.
Myth #2 – The utility sells the power purchased at retail back to other customers at retail so the net so it’s a wash: Borenstein’s claim ignores the fact that when the NEM program began the utilities were buying power that cost more than the retail rate at the time. During NEM 1.0 the IOUs were paying in excess of 10c/kwh for renewable power (RPS) power purchase agreements (PPAs). Add the 4c/kWh for transmission and that’s more than the average rate of 13c/kWh that prevailed during that time. NEM 2.0 added a correction for TOU pricing (that PG&E muffled by including only the marginal generation cost difference by TOU rather than scaling) and that adjusted the price some. But those NEM customers signed up not knowing what the future retail price would be. That’s the downside of failing to provide a fixed price contract tariff option for solar customers back then. So now the IOUs are bearing the consequences of yet another bad management decision because they were in denial about what was coming.
Myth #3 – Rooftop solar is about disrupting the industry: Here Borenstein appears to be unaware of the Market Street Railway case that states that utilities are not protected from technological change. Protecting companies from the consequences of market forces is corporate socialism. If we’re going to protect shareholders from risk (and its even 100% protection), then the grid should be publicly owned instead. Sam Insull set up the regulatory scam a century ago arguing that income assurance was needed for grid investment, and when the whole scheme collapsed in the Depression, the Public Utility Holding Company Act of 1935 (PUHCA)was passed. Shareholders need to pick their poison—either be exposed to risk or transfer their assets public ownership, but wealthy shareholders should not be protected.
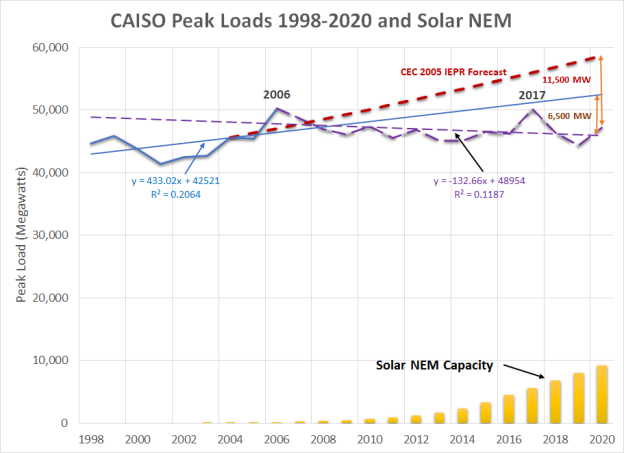
Myth #3A – Utilities made bad investments and should bear the risks: Borenstein is arguing since the utilities have run the con for the last decade and gotten approval from the CPUC, they should be protected. Yet I submitted testimony repeatedly starting in 2010 both PG&E’s and SCE’s GRCs that warned that they had overforecasted load growth. I was correct—statewide retail sales are about the same today as they were in 2006. Grid investment would have been much different if those companies had listened and corrected their forecasts. Further the IOUs know how to manipulate their regulatory filings to ensure that they still get their internally targeted income. Decoupling that ensures that the utility receives its guaranteed income regardless of sales further shields them. From 1994 to 2017, PG&E hit its average allowed rate of return within 0.1%. (More on this later.) A UCB economics graduate student found that the return on equity is up to 4% too high (consistent with analysis I’ve done).
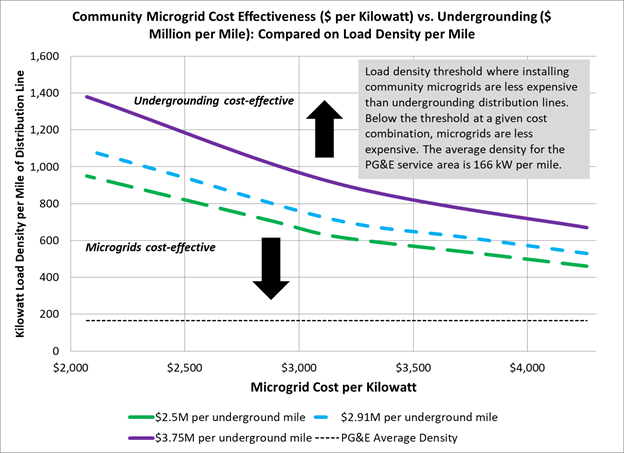
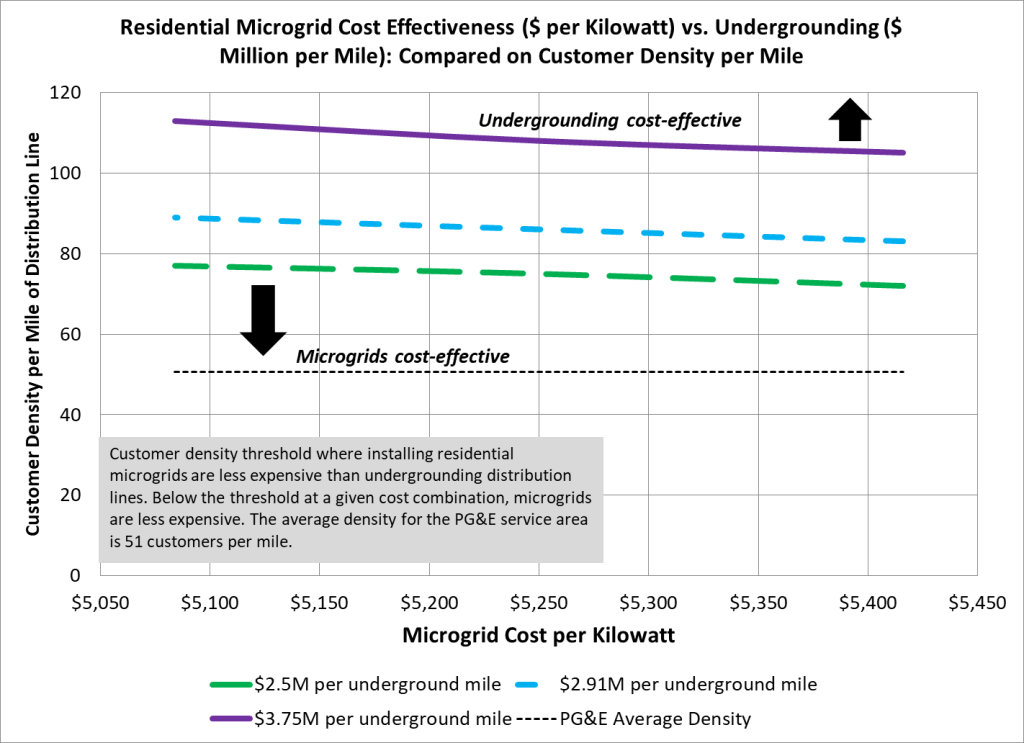
Myth #3B – Time to take away the utility’s monopoly: No, we no longer need to have monopoly electric service. The same was said about telecommunications three decades ago. Now we have multiple entities vying for our dollars. The CPUC conducted a study in 1999 that was included in PG&E’s GRC proposed decision (thanks to the late Richard Bilas) that showed that economies of scale disappeared after several hundred thousand customers (and that threshold is likely lower now.) And microgrids are becoming cost effective, especially as PG&E’s rates look like they will surpass 30 cents per kWh by 2026.
Myth #4 – There aren’t barriers to the poor putting panels on their roofs: First, the barriers are largely regulatory, not financial. The CPUC has erected them to prevent aggregation of low-income customers to be able to buy into larger projects that serve these communities.
Second, there are many market mechanisms today where those with lower income are offered products or services at a higher long term price in return for low or no upfront costs. Are we also going to heavily tax car purchases because car leasing is effectively more expensive? What about house ownership vs. rentals? There are issues to address with equity, but to zero in on one small example while ignoring the much wider prevalence sets up another strawman argument.
Further, there are better ways to address the inequity in rooftop solar distribution. That inequity isn’t occurring duo to affordability but rather because of split incentives between landlords and tenants.
A much easier and more direct fix would be to modify Public Utilities Code Sections 218 to allow local sales among customers or by landlords or homeowner associations to tenants and 739.5 to allow more flexibility in pricing those sales. But allowing those changes will require that the utilities give up iron-fisted control of electricity production.
Myth #5 – Rooftop solar is the only thing that makes it cost-effective to electrify: Borenstein focuses on the what source of high rates. Rooftop solar might be raising rates, but it probably delivered as much in offsetting savings. At most those customers increased rates by 10%, but utility rates are 70-100% above the direct marginal costs of service. The sources of that difference are manifest. PG&E has filed in its 2023 GRC a projected increase in the average standard residential rate to 38 cents per kWh by 2026, and perhaps over 40 cents once undergrounding to mitigate wildfire is included. The NREL studies on microgrids show that individual home microgrids cost about 34 cents per kWh now and battery storage prices are still dropping. Exiting the grid starts to look a lot more attractive.
Maybe if we look only at the status quo as unchanging and accept all of the utilities’ claims about their “necessary” management decisions and the return required to attract investors, then these arguments might hold water. But none of these factors are true based on the empirical work presented in many forums including at the CPUC over the last decade. These beliefs are not so mythological.
Finally, Borenstein finishes with “(a)nd we all need to be open to changing our minds as a result of changing technology and new data.” Yet he has been particularly unyielding on this issue for years, and has not reexamined his own work on electricity markets from two decades ago. The meeting of open minds requires a two-way street.