

A response to Severin Borenstein’s post at UC Energy Institute where he posits a large subsidy flowing to NEM customers and proposes an income-based fixed charge as the remedy. Borenstein made the same proposal at a later CPUC hearing.
The CPUC is now considering reforming the current net energy metering (NEM) tariffs in the NEM 3.0 proceeding. And the State Legislature is considering imposing a change by fiat in AB 1139.
First, to frame this discussion, economists are universally guilty of status quo bias in which we (since I’m one) too often assume that changing from the current physical and institutional arrangement is a “cost” in an implicit assumption that the current situation was somehow arrived at via a relatively benign economic process. (The debate over reparations for slavery revolve around this issue.) The same is true for those who claim that NEM customers are imposing exorbitant costs on other customers.
There are several issues to be considered in this analysis.
1) In looking at the history of the NEM rate, the emergence of a misalignment between retail rates that compensate solar customers and the true marginal costs of providing service (which are much more than the hourly wholesales price–more on that later) is a recent event. When NEM 1.0 was established residential rates were on the order of 15 c/kWh and renewable power contracts were being signed at 12 to 15 c/kWh. In addition, the transmission costs were adding 2 to 4 c/kWh. This was the case through 2015; NEM 1.0 expired in 2016. NEM 2.0 customers were put on TOU rates with evening peak loads, so their daytime output is being priced at off peak rates midday and they are paying higher on peak rates for usage. This despite the fact that the difference in “marginal costs” between peak and off wholesale costs are generally on the order of a penny per kWh. (PG&E NEM customers also pay a $10/month fixed charge that is close to the service connection cost.) Calculating the net financial flows is more complicated and deserve that complex look than what can be captured in a simple back of the envelope calculation.
2) If we’re going to dig into subsidies, the first place to start is with utility and power plant shareholders. If we use the current set of “market price benchmarks” (which are problematic as I’ll discuss), out of PG&E’s $5.2 billion annual generation costs, over $2 billion or 40% are “stranded costs” that are subsidies to shareholders for bad investments. In an efficient marketplace those shareholders would have to recover those costs through competitively set prices, as Jim Lazar of the Regulatory Assistance Project has pointed out. One might counter those long term contracts were signed on behalf of these customers who now must pay for them. Of course, overlooking whether those contracts were really properly evaluated, that’s also true for customers who have taken energy efficiency measures and Elon Musk as he moves to Texas–we aren’t discussing whether they also deserve a surcharge to cover these costs. But beyond this, on an equity basis, NEM 1.0 customers at least made investments based on an expectation, that the CPUC did not dissuade them of this belief (we have documentation of how at least one county government was mislead by PG&E on this issue in 2016). If IOUs are entitled to financial protection (and the CPUC has failed to enact the portfolio management incentive specified in AB57 in 2002) then so are those NEM customers. If on the other hand we can reopen cost recovery of those poor portfolio management decisions that have led to the incentive for retail customers to try to exit, THEN we can revisit those NEM investments. But until then, those NEM customers are no more subsidized than the shareholders.
3) What is the true “marginal cost”? First we have the problem of temporal consistency between generation vs. transmission and distribution grid (T&D) costs. Economists love looking at generation because there’s a hourly (or subhourly) “short run” price that coincides nicely with economic theory and calculus. On the other hand, those darn T&D costs are lumpy and discontinuous. The “hourly” cost for T&D is basically zero and the annual cost is not a whole lot better. The current methods debated in the General Rate Cases (GRC) relies on aggregating piecemeal investments without looking at changing costs as a whole. Probably the most appropriate metric for T&D is to calculate the incremental change in total costs by the number of new customers. Given how fast utility rates have been rising over the last decade I’m pretty sure that the “marginal cost” per customer is higher than the average cost–in fact by definition marginal costs must be higher. (And with static and falling loads, I’m not even sure how we calculated the marginal costs per kwh. We can derive the marginal cost this way FERC Form 1 data.) So how do we meld one marginal cost that might be on a 5-minute basis with one that is on a multi-year timeframe? This isn’t an easy answer and “rough justice” can cut either way on what’s the truly appropriate approximation.
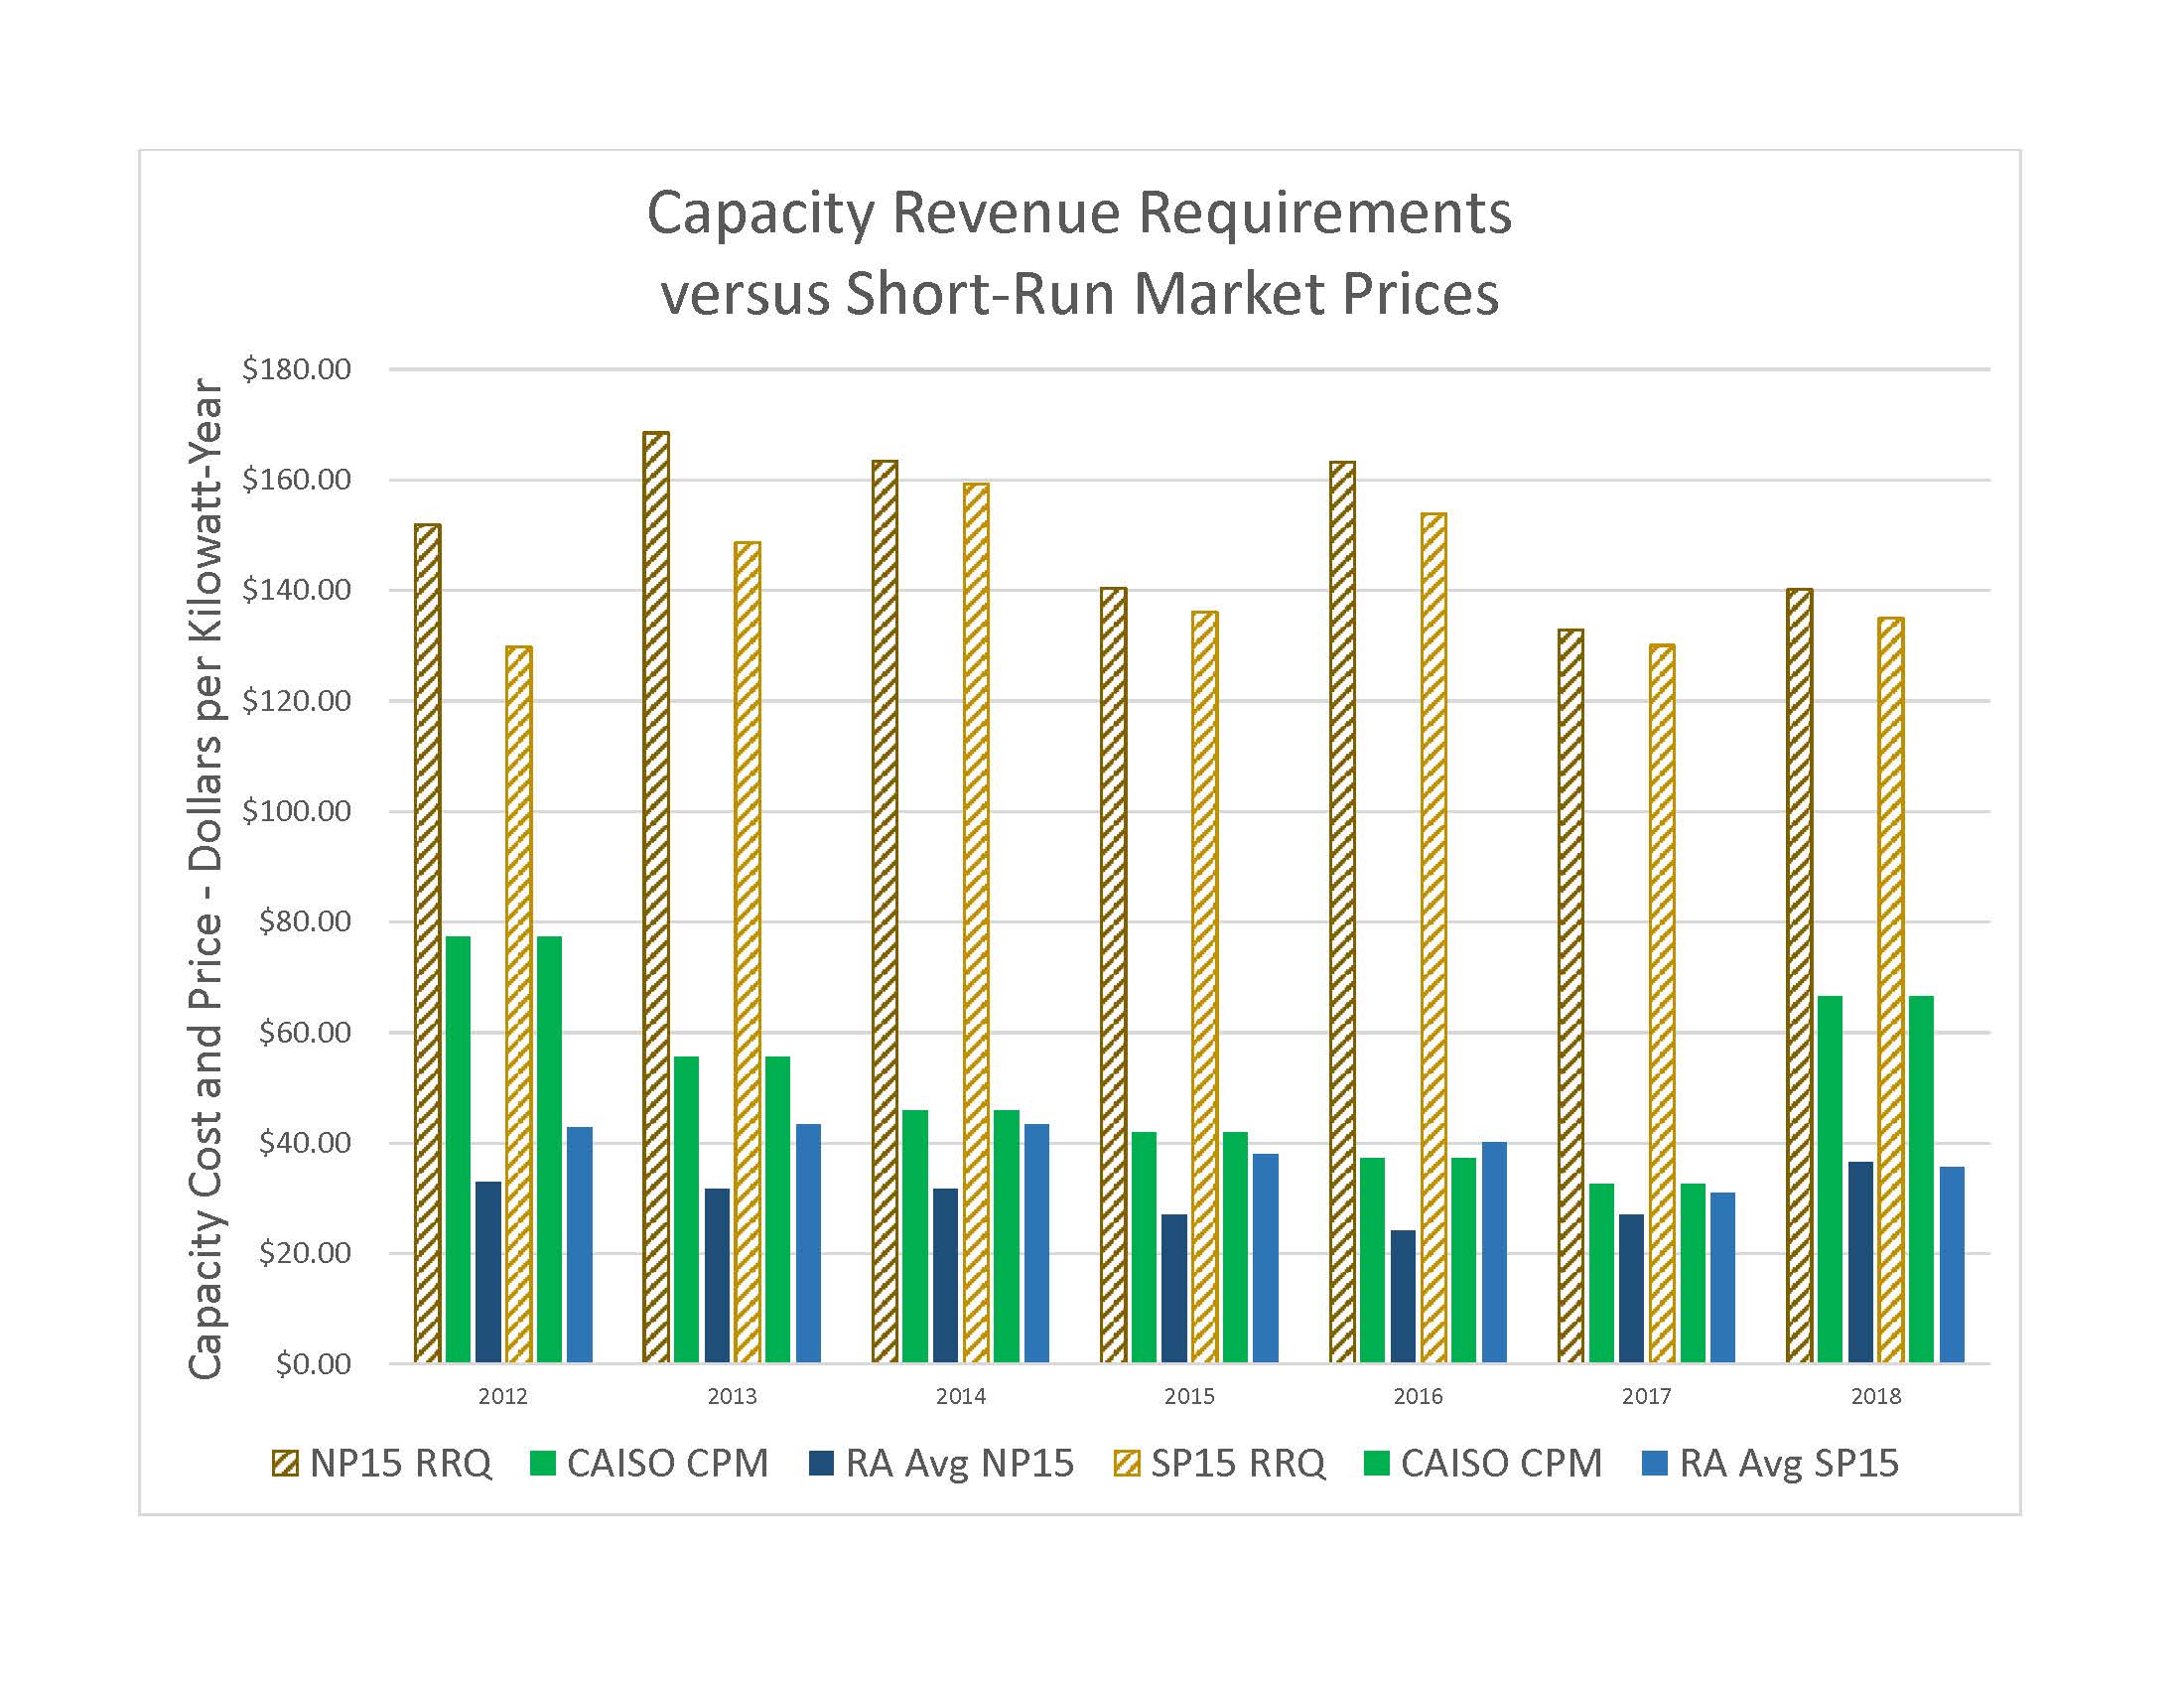
4) Even if the generation cost is measured sub hourly, the current wholesale markets are poor reflections of those costs. Significant market distortions prevent fully reflecting those costs. Unit commitment costs are often subsidized through out of market payments; reliability regulation forces investment that pushes capacity costs out of the hourly market, added incremental resources–whether for added load such as electrification or to meet regulatory requirements–are largely zero-operating cost renewables of which none rely on hourly market revenues for financial solvency; in California generators face little or no bankruptcy risk which allows them to underprice their bids; on the flip side, capacity price adders such as ERCOT’s ORDC overprices the value of reliability to customers as a backdoor way to allow generators to recover investments through the hourly market. So what is the true marginal cost of generation? Pulling down CAISO prices doesn’t look like a good primary source of data.
We’re left with the question of what is the appropriate benchmark for measuring a “subsidy”? Should we also include the other subsidies that created the problem in the first place?


 CCAs may have to choose between complying with the long-term commitments specified in